Class 6 Maths Chapter 4 – Data Handling and Presentation | Notes, Solutions & Worksheet

Class 6 Maths Chapter 4 Data Handling and Presentation – easy notes, concepts, NCERT book solutions, important questions, worksheet and answers. Learn how to collect, organise, represent and interpret data using tables, pictographs and simple charts with easy explanations.

Class 6 Mathematics Chapter 4 Data Handling and Presentation

Class 6 Mathematics

Ganita Prakash • Chapter 4

DATA HANDLING AND PRESENTATION

Complete colourful chapter concepts, in-text questions, Figure it Out questions and easy solutions

Reprint 2026–27 • Pages 74–106

100%
Page 75

4.1 Organising Data

Concept: Data means facts, numbers, observations or information collected to answer a question. For example, if we ask every student about their favourite game, the answers form data.
Favourite Games — Data Collection
GameNumber of students
Hockey8
Satoliya (Pittu)6
Kabaddi6
Cricket5
Football3
Badminton2

Figure it Out — Q1

What would you do to find the most popular game among Naresh’s and Navya’s classmates?

Arrange and organise the data in a table. Count how many students chose each game. The game with the highest frequency is the most popular.

Figure it Out — Q2

What is the most popular game in their class?

Hockey, with a frequency of 8.

Figure it Out — Q3

Try to find out the most popular game among your classmates.

Ask every classmate for their favourite game, record the answers, count each game and compare the frequencies.

Figure it Out — Q4

Pari wants to respond to the questions given below. Put a tick ( ✓) for the questions where she needs to carry out data collection and put a cross (✕) for the questions where she doesn’t need to collect data. Discuss your answers in the classroom.

  1. What is the most popular TV show among her classmates?
  2. When did India get independence?
  3. How much water is getting wasted in her locality?
  4. What is the capital of India?
a. ✓ Data collection needed.
b. ✕ Data collection not needed.
c. ✓ Data collection needed.
d. ✕ Data collection not needed.
Page 76
Tally Marks: Tally marks help us count data quickly. Four vertical marks are crossed by the fifth mark.

Frequency: The number of times a particular observation occurs is called its frequency.
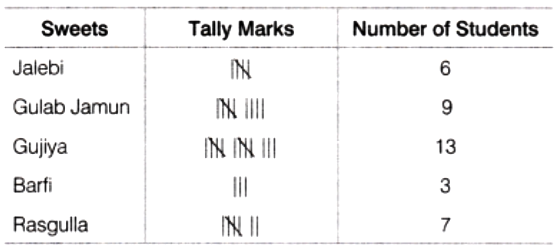
Figure it Out — Q1

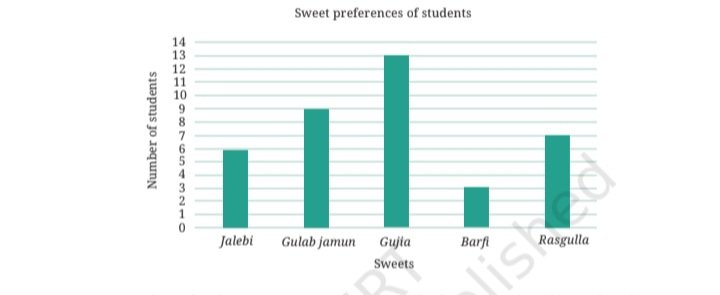
Complete the table to help Shri Nilesh to purchase the correct numbers of sweets:

  1. How many students chose jalebi?
  2. Barfi was chosen by students?
  3. How many students chose gujiya?
  4. Rasgulla was chosen by students?
  5. How many students chose gulab jamun?
a. 6
b. 3
c. 13
d. 7
e. 9

Figure it Out — Q2

Is the above table sufficient to distribute each type of sweet to the correct student? Explain. If it is not sufficient, what is the alternative?

No. The table tells only how many students chose each sweet, not which student chose which sweet.

Alternative: Make groups of students according to their sweet choice.
Page 77

Arranging Data

Arranging data in ascending order makes it easier to find the smallest value, largest value and frequency of a particular value.
Shoe Sizes

3, 3, 3, 4, 4, 4, 4, 4, 4, 4, 4, 4, 5, 5, 5, 5, 5, 5, 5, 5, 5, 5, 6, 6, 6, 6, 7

Figure it Out — Q1

Help her to figure out the following:

  1. The largest shoe size in the class is _________.
  2. The smallest shoe size in the class is _________.
  3. There are _________ students who wear shoe size 5.
  4. There are _________ students who wear shoe sizes larger than 4.
a. 7
b. 3
c. 10
d. 15

Figure it Out — Q2

How did arranging the data in ascending order help to answer these questions?

Ordered data makes it easier to count frequencies and find useful information quickly.

Figure it Out — Q3

Are there other ways to arrange the data?

Yes. We can arrange the data in a frequency table.
Page 78

Figure it Out — Q4

do it yourself .Write the names of a few trees you see around you. When you observe a tree on the way from your home to school (or while walking from one place to another place), record the data and fill in the following table:

TreeNo. of Trees
Peepal____
Neem____
Other____
  1. Which tree was found in the greatest number?
  2. Which tree was found in the smallest number?
  3. Were there any two trees found in the same numbers?
This is a data-collection activity. Record the trees you actually observe and compare their frequencies.

Figure it Out — Q5

do it yourself. Take a blank piece of paper and paste any small news item from a newspaper. Each student may use a different article. Now, prepare a table on the piece of paper as given below. Count the number of each of the letters ‘c’, ‘e’, ‘i’, ‘r’, and ‘x’ in the words of the news article, and fill in the table.

LetterceirxAny other letter of your choice
Number of times found in the news item__________________
  1. The letter found the most number of times is ________.
  2. The letter found the least number of times is ________.
  3. List the five letters ‘c’, ‘e’, ‘i’, ‘r’, ‘x’ in ascending order of frequency. Now, compare the order of your list with that of your classmates. Is your order the same or nearly the same as theirs? (Almost everyone is likely to get the order ‘x, c, r, i, e’.) Why do you think this is the case?
  4. Write the process you followed to complete this task.
  5. Discuss with your friends the processes they followed.
  6. If you do this task with another news item, what process would you follow?
a. Depends on the article.
b. Depends on the article.
c. A common order is x, c, r, i, e. These letters occur with different frequencies in ordinary English writing.
d. Count each required letter and record its frequency.
e. Compare your method with classmates.
f. Repeat the same counting process for the new article.
Pages 79–80

4.2 Pictographs

Pictograph: A pictograph represents data using pictures or symbols. A key tells us how many objects each symbol represents.
🧍 = 1 student
👥 = 10 children
½ symbol = 5 children when 1 symbol = 10

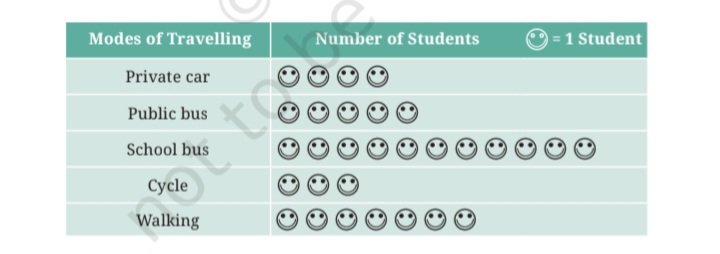
Questions from Page 79

Which mode of travel is used by the most number of students?

school bus

Which mode of travel is used by the least number of students?

cycle

Page 80 — Questions using the pictograph

1. What is the number of children who always slept at least 9 hours at night?
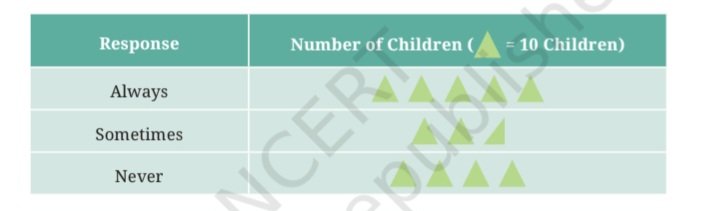
5 × 10 = 50 children.

2. How many children sometimes slept at least 9 hours at night?

2½ × 10 = 25 children.

3. How many children always slept less than 9 hours each night? Explain how you got your answer.

4 × 10 = 40 children never slept at least 9 hours, so 40 children always slept less than 9 hours.
Pages 81–82

Drawing a Pictograph

ClassIIIIIIIVVVIVIIVIII
Absent35420157

When the data is large, using one symbol for one object may take too much space. A symbol can represent 5, 10 or another suitable number.
Why choose a scale?

30 students → if 1 symbol = 1 student, we need 30 symbols.

30 students → if 1 symbol = 5 students, we need only 6 symbols.

So a suitable scale saves time and space.

Page 82 — Question

What could be the problems faced in preparing such a pictograph, if the total number of students present in a class is 33 or 27?

If 1 symbol represents 10 students, it is difficult to show 3 or 7 students exactly. A half symbol represents 5 students, but 3 and 7 still cannot be shown exactly with whole or half symbols.
Pages 83–84

Reading Pictographs

A good pictograph should have:
  • Clear categories
  • A clear key or scale
  • Equal-sized symbols
  • Correct number of symbols

Figure it Out — Q1

The following pictograph shows the number of books borrowed by students, in a week, from the library of Middle School, Ginnori:

  • On which day were the minimum number of books borrowed?
  • What was the total number of books borrowed during the week?
  • On which day were the maximum number of books borrowed? What may be the possible reason?
  • a. Thursday.
    b. Total = 24 books.
    c. Saturday. One possible reason is that Sunday is a holiday, so students may borrow books on Saturday to read on Sunday.

    Figure it Out — Q2

    Magan Bhai sells kites at Jamnagar. Six shopkeepers from nearby villages come to purchase kites from him. The number of kites he sold to these six shopkeepers are given below —

    Prepare a pictograph using the symbol to represent 100 kites.
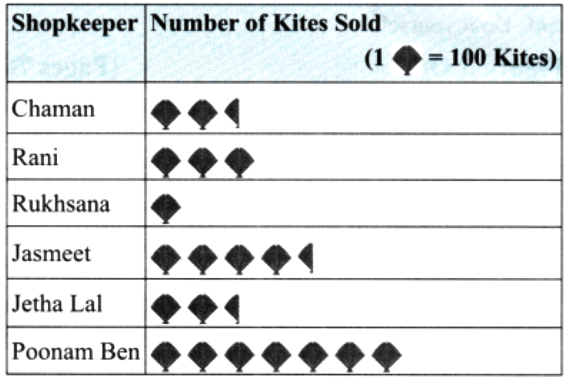
    1. How many symbols represent the kites that Rani purchased?
    2. Who purchased the maximum number of kites?
    3. Who purchased more kites, Jasmeet or Chaman?
    4. Rukhsana says Poonam Ben purchased more than double the number of kites that Rani purchased. Is she correct? Why?
    a. 3 symbols.
    b. Poonam Ben.
    c. Jasmeet.
    d. Yes. 700 is more than 2 × 300 = 600.
    Pages 85–88

    4.3 Bar Graphs

    Bar Graph: A bar graph uses equal-width bars to represent data. The height or length of each bar shows the value.

    Page 86 — Questions using the bar graph

    1. In Class 2, ___________ students were absent that day.

    5 students.

    2. In which class were the maximum number of students absent? ___________

    Class 8.

    3. Which class had full attendance that day? ___________

    Class 5.
    Scale: A graph can use a scale such as 1 unit = 1 student or 1 unit = 100 vehicles. Always read the scale carefully.

    Traffic at a Road Crossing
    TimeVehicles
    6–7 a.m.150
    7–8 a.m.1200
    8–9 a.m.800
    9–10 a.m.1000
    10–11 a.m.700
    11–12 noon600

    Page 88 — Figure it Out — Q1

    How many total cars passed through the crossing between 6 a.m. and noon?

    150 + 1200 + 800 + 1000 + 700 + 600 = 4450 cars.

    Page 88 — Figure it Out — Q2

    Why do you think so little traffic occurred during the hour of 6–7 a.m., as compared to the other hours from 7 a.m.–noon?

    Early morning usually has fewer people travelling to work, school and other places.

    Page 88 — Figure it Out — Q3

    Why do you think the traffic was the heaviest between 7–8 a.m.?

    It may be rush hour because many people travel to schools and workplaces.

    Page 88 — Figure it Out — Q4

    Why do you think the traffic was lesser and lesser each hour after 8 a.m. all the way until noon?

    The morning rush gradually decreases after people reach schools, offices and other destinations.
    Page 88
    A large quantity of data is easier to understand when we choose a suitable scale. For population in crores, 1 unit can represent 10 crores.
    YearPopulation of India in crores
    195136
    196144
    197154
    198168
    199184
    2001102

    On the basis of this bar graph, what may be a few questions you may ask your friends?

    Examples: Which year had the highest population? How much did the population increase from 1951 to 2001?

    How much did the population of India increase over 50 years? How much did the population increase in each decade?

    From 1951 to 2001: 102 − 36 = 66 crores. For each decade, subtract the previous value from the next value.
    Pages 89–93

    4.4 Drawing a Bar Graph

    Steps:
    1. Draw horizontal and vertical axes.
    2. Write the categories equally spaced.
    3. Choose a suitable scale.
    4. Draw equal-width bars.
    5. Make each bar reach its correct value.
    SweetNo. of Students
    Jalebi6
    Gulab jamun9
    Gujiya13
    Barfi3
    Rasgulla7

    For Smriti’s runs, a useful scale is 1 unit = 10 runs. For Imran’s expenditure, a useful scale is 1 unit = ₹200.

    Page 93 — Questions using Imran’s bar graph

    1. On which item does Imran’s family spend the most and the second most?

    Most: Food. Second most: House rent.

    2. Is the cost of electricity about one-half the cost of education?

    Yes. Electricity = ₹400 and half of education = ₹800 ÷ 2 = ₹400.

    3. Is the cost of education less than one-fourth the cost of food?

    Yes. ₹3400 ÷ 4 = ₹850 and ₹800 is less than ₹850.

    Figure it Out — Q1

    Samantha visited a tea garden, and collected data of the insects and critters she saw there. Here is the data she collected:

    Help her prepare a bar graph representing this data.
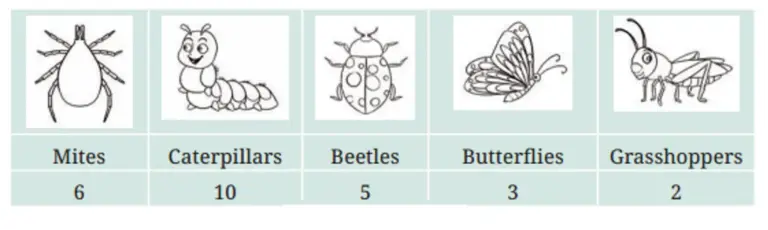
    Figure it Out — Q2

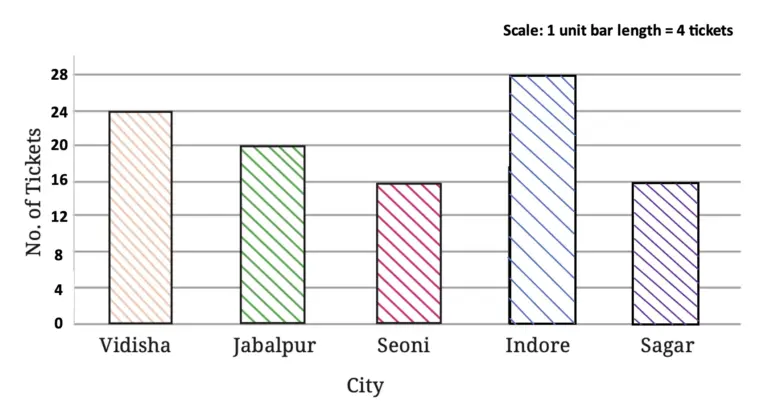
    Pooja collected data on the number of tickets sold at the Bhopal railway station for a few different cities of Madhya Pradesh over a two-hour period.

    <

    She used this data and prepared a bar graph on the board to discuss the data with her students, but someone erased a portion of the graph.

    1. Write the number of tickets sold for Vidisha above the bar.
    2. Write the number of tickets sold for Jabalpur above the bar.
    3. The bar for Vidisha is 6 unit lengths and the bar for Jabalpur is 5 unit lengths. What is the scale for this graph?
    4. Draw the correct bar for Sagar.
    5. Add the scale of the bar graph by placing the correct numbers on the vertical axis.
    6. Are the bars for Seoni and Indore correct in this graph? If not, draw the correct bar(s).

    a. 24
    b. 20
    c. 1 unit length = 4 tickets
    d. Sagar = 16 tickets, so its bar has 4 units.
    e. Mark the vertical scale 0, 4, 8, 12, 16, 20, 24, 28.
    f. Seoni is correct. Indore is incorrect and should reach 28.
    Pages 94–96

    Figure it Out — Q3

    Chinu listed the various means of transport that passed across the road in front of his house from 9 a.m. to 10 a.m.:

    bike • car • bike • bus • bike • bike
    bike • auto rickshaw • bicycle • bullock cart
    bicycle • auto rickshaw • car • scooter • car • auto rickshaw
    bicycle • bike • car • auto rickshaw • bike • scooter • bike • car
    bicycle • scooter • bicycle • scooter • bike • bus
    auto rickshaw • auto rickshaw • bike • bicycle • bus • bike
    bicycle • scooter • bus • scooter • auto rickshaw • bike
    scooter • bicycle • bike • bullock cart • auto rickshaw • scooter • car • scooter
    1. Prepare a frequency distribution table for the data.
    2. Which means of transport was used the most?
    3. If you were there to collect this data, how could you do it? Write the steps or process.
    a.


    b. Bike.
    c. Make a table, list each vehicle type, observe vehicles as they pass, and add one tally mark for each vehicle.

    Figure it Out — Q4

    Roll a die 30 times and record the number you obtain each time. Prepare a frequency distribution table using tally marks. Find the number that appeared:

    1. The minimum number of times.
    2. The maximum number of times.
    3. Find numbers that appeared an equal number of times.
    do it yourself.The answer depends on your 30 throws. Make a tally table and compare the frequencies.

    Figure it Out — Q5

    Faiz prepared a frequency distribution table of data on the number of wickets taken by Jaspreet Bumrah in his last 30 matches:

    Wickets TakenNumber of Matches
    02
    14
    26
    38
    43
    55
    61
    71
    1. What information is this table giving?
    2. What may be the title of this table?
    3. What caught your attention in this table?
    4. In how many matches has Bumrah taken 4 wickets?
    5. Mayank says, “If we want to know the total number of wickets he has taken in his last 30 matches, we have to add the numbers 0, 1, 2, 3 …, up to 7.” Can Mayank get the total number of wickets taken in this way? Why?
    6. How would you correctly figure out the total number of wickets taken by Bumrah in his last 30 matches, using this table?
    a. It shows how many matches had each wicket count.
    b. Wickets Taken by Jaspreet Bumrah in Last 30 Matches.
    c. He took 7 wickets in one match.
    d. 3 matches.
    e. No. We must multiply wickets by the number of matches.
    f. Add: (0×2)+(1×4)+(2×6)+(3×8)+(4×3)+(5×5)+(6×1)+(7×1) = 90 wickets.

    Figure it Out — Q6

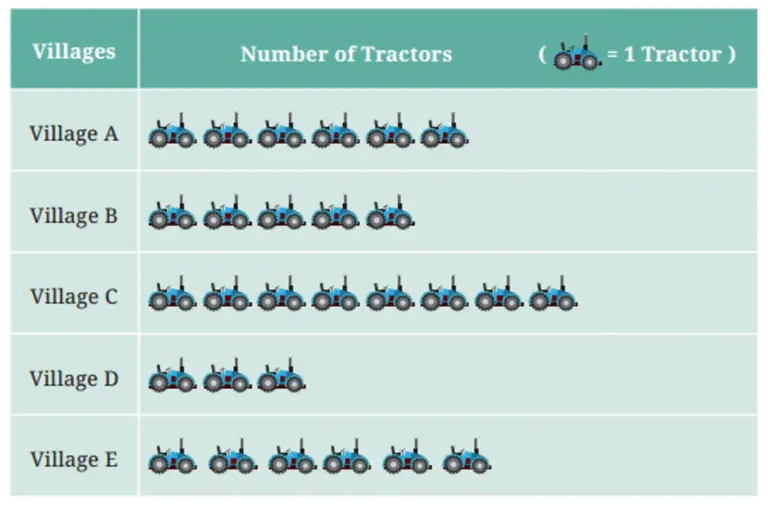
    The following pictograph shows the number of tractors in five different villages.

    Observe the pictograph and answer the following questions—

    1. Which village has the smallest number of tractors?
    2. Which village has the most tractors?
    3. How many more tractors does Village C have than Village B?
    4. Komal says, “Village D has half the number of tractors as Village E.” Is she right?
    a. Village D.
    b. Village C.
    c. 3 tractors.
    d. Yes.
    Pages 97–98

    Figure it Out — Q7

    The number of girl students in each class of a school is depicted by the pictograph:

    Observe this pictograph and answer the following questions:

    1. Which class has the least number of girl students?
    2. What is the difference between the number of girls in Classes 5 and 6?
    3. If two more girls were admitted in Class 2, how would the graph change?
    4. How many girls are there in Class 7?
    a. Class 8.
    b. 6 girls.
    c. The half symbol in Class 2 would become a full symbol.
    d. 12 girls.

    Figure it Out — Q8

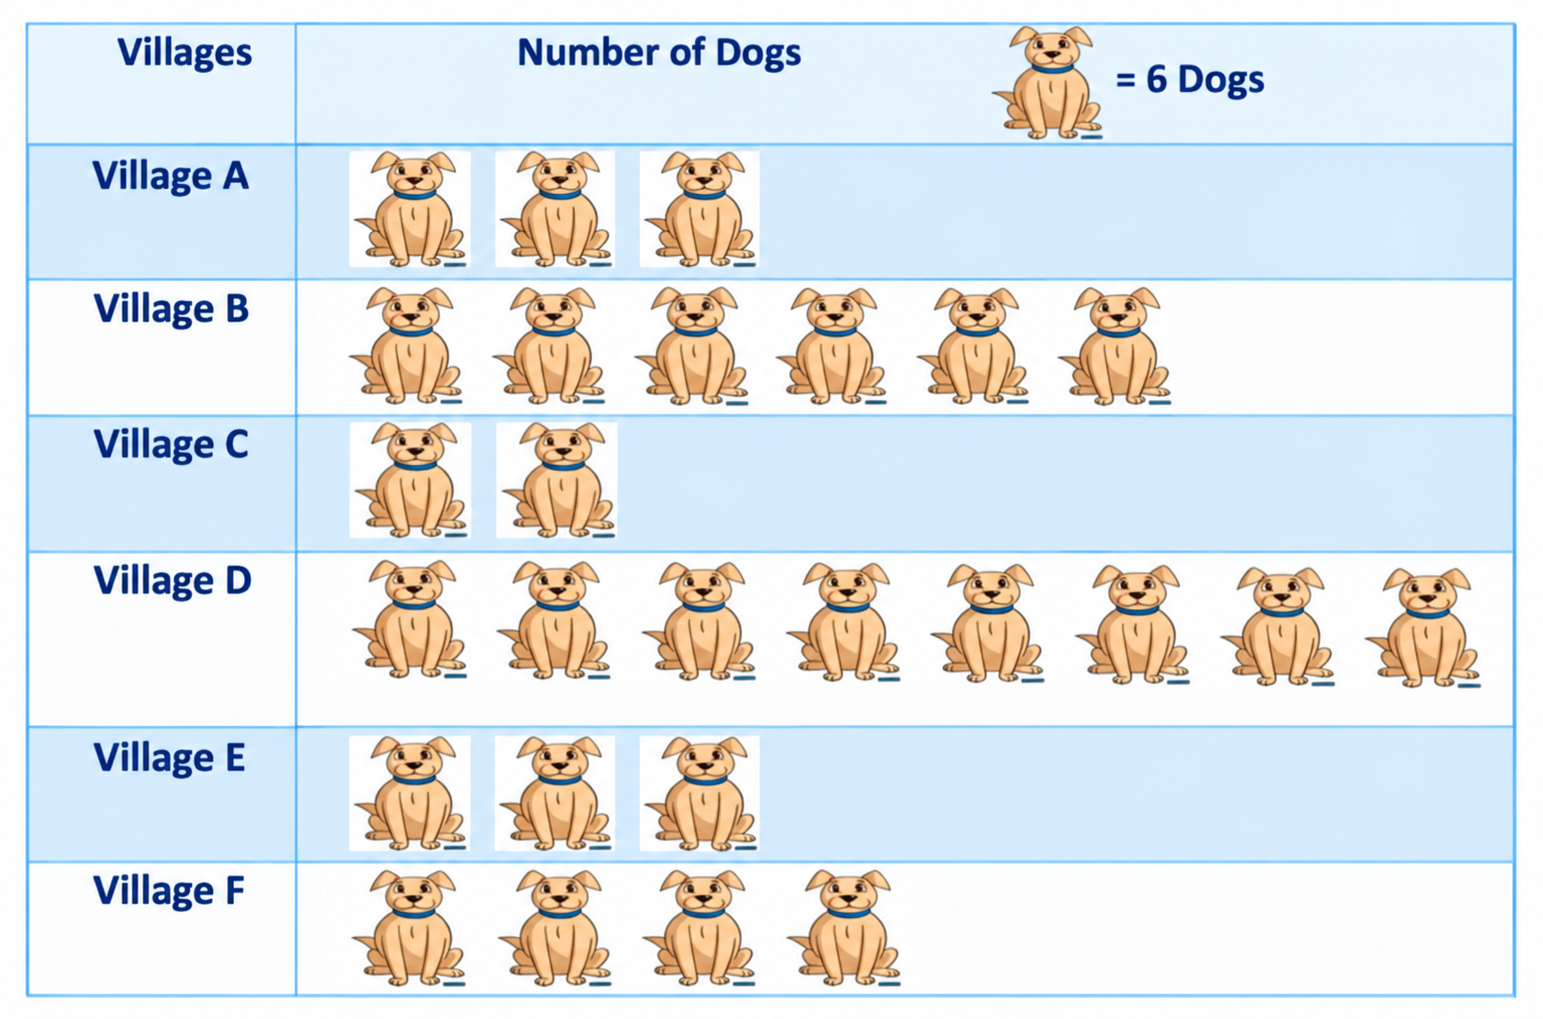
    Mudhol Hounds (a type of breed of Indian dogs) are largely found in North Karnataka’s Bagalkote and Vijaypura districts. The government took an initiative to protect this breed by providing support to those who adopted these dogs. Due to this initiative, the number of these dogs increased. The number of Mudhol dogs in six villages of Karnataka are as follows—

    Village A : 18, Village B : 36, Village C : 12, Village D : 48, Village E : 18, Village F : 24

    Prepare a pictograph and answer the following questions:

    1. What will be a useful scale or key to draw this pictograph?
    2. How many symbols will you use to represent the dogs in Village B?
    3. Kamini said that the number of these dogs in Village B and Village D together will be more than the number of these dogs in the other 4 villages. Is she right? Give reasons for your response.
    pictograph for this exercise
    a. 1 symbol = 6 dogs.
    b. Village B needs 6 symbols.
    c. Yes. B + D = 36 + 48 = 84. The other four villages have 18 + 12 + 18 + 24 = 72. Therefore 84 > 72.

    Figure it Out — Q9

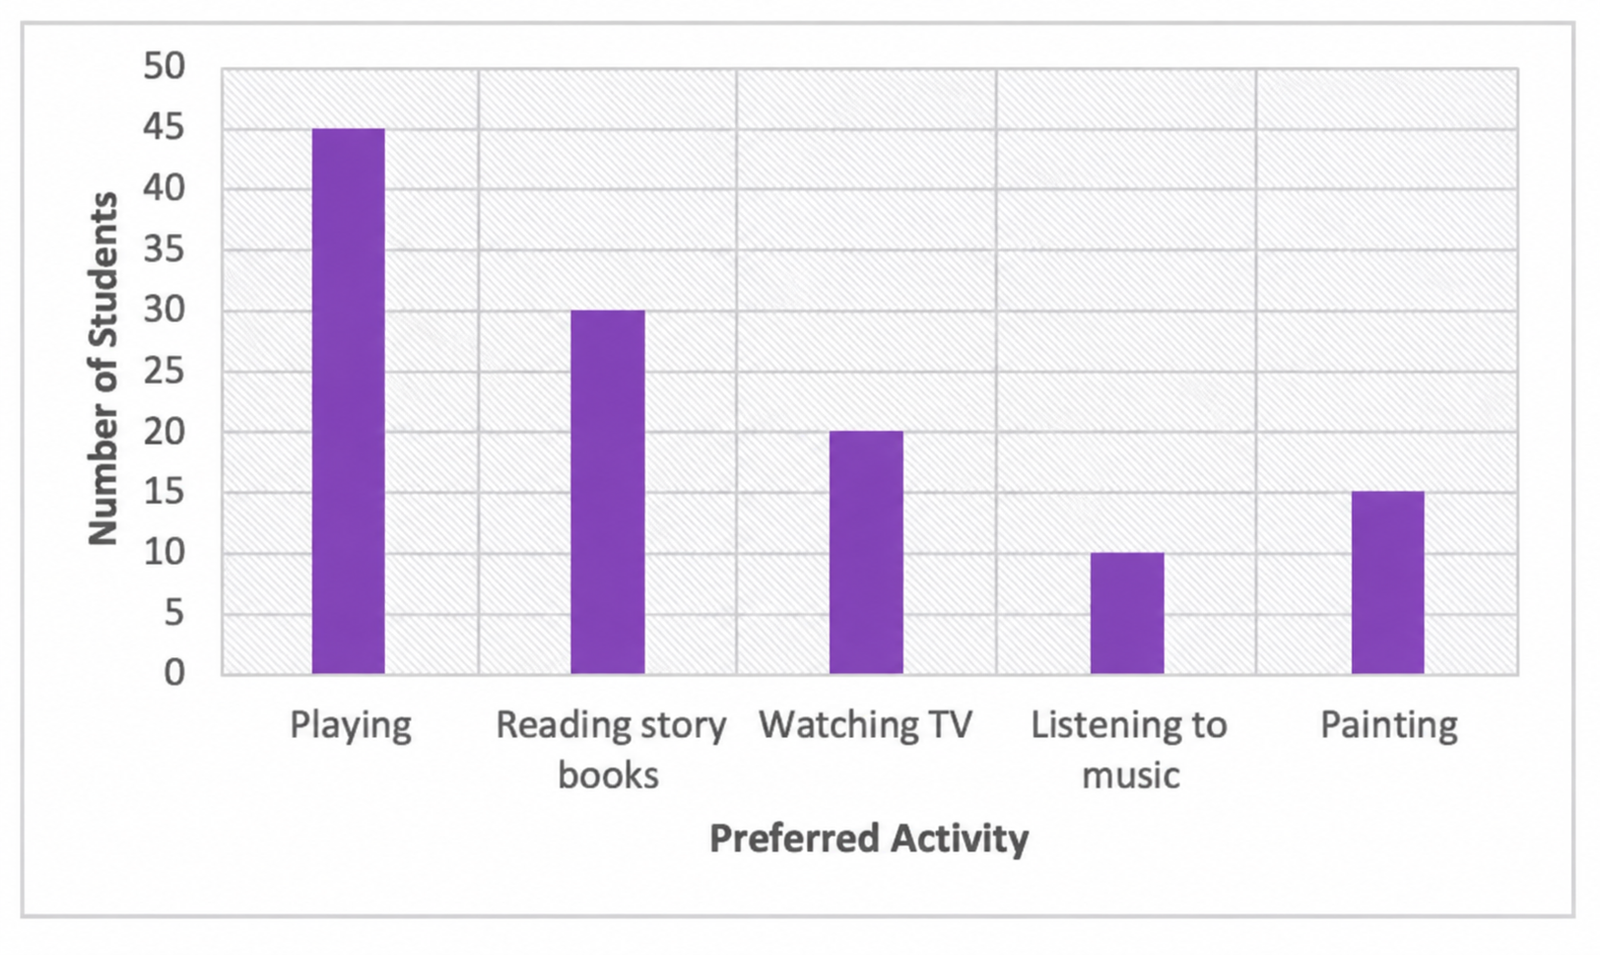
    A survey of 120 school students was conducted to find out which activity they preferred to do in their free time:

    Preferred ActivityNumber of StudentsBar Height, 1 unit = 5 students
    Playing459
    Reading story books306
    Watching TV204
    Listening to music102
    Painting153

    Draw a bar graph to illustrate the above data taking the scale of 1 unit length = 5 students. Which activity is preferred by most students other than playing?

    Reading story books is preferred by most students.
    Pages 99–100

    Figure it Out — Q10

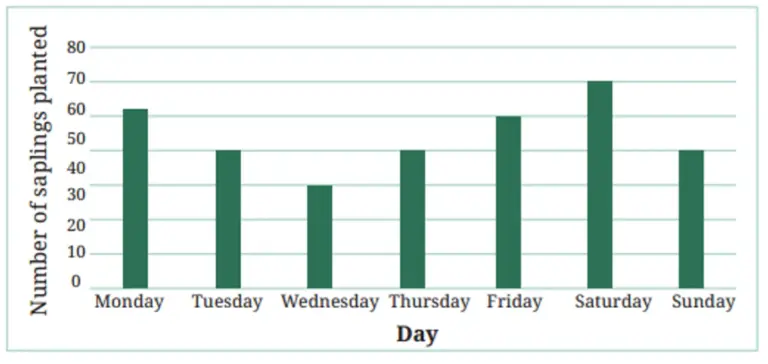
    Students and teachers of a primary school decided to plant tree saplings in the school campus and in the surrounding village during the first week of July. Details of the saplings they planted are as follows—

    1. The total number of saplings planted on Wednesday and Thursday is ___________.
    2. The total number of saplings planted during the whole week is ___________.
    3. The greatest number of saplings were planted on ___________ and the least number of saplings were planted on ___________. Why do you think that is the case? Why were more saplings planted on certain days of the week and less on others? Can you think of possible explanations or reasons? How could you try and figure out whether your explanations are correct?
    a. 70
    b. 310
    c. Greatest: Saturday. Least: Wednesday.
    Possible reasons include weather or different numbers of students present. We can check the reason by collecting more data.

    Figure it Out — Q11

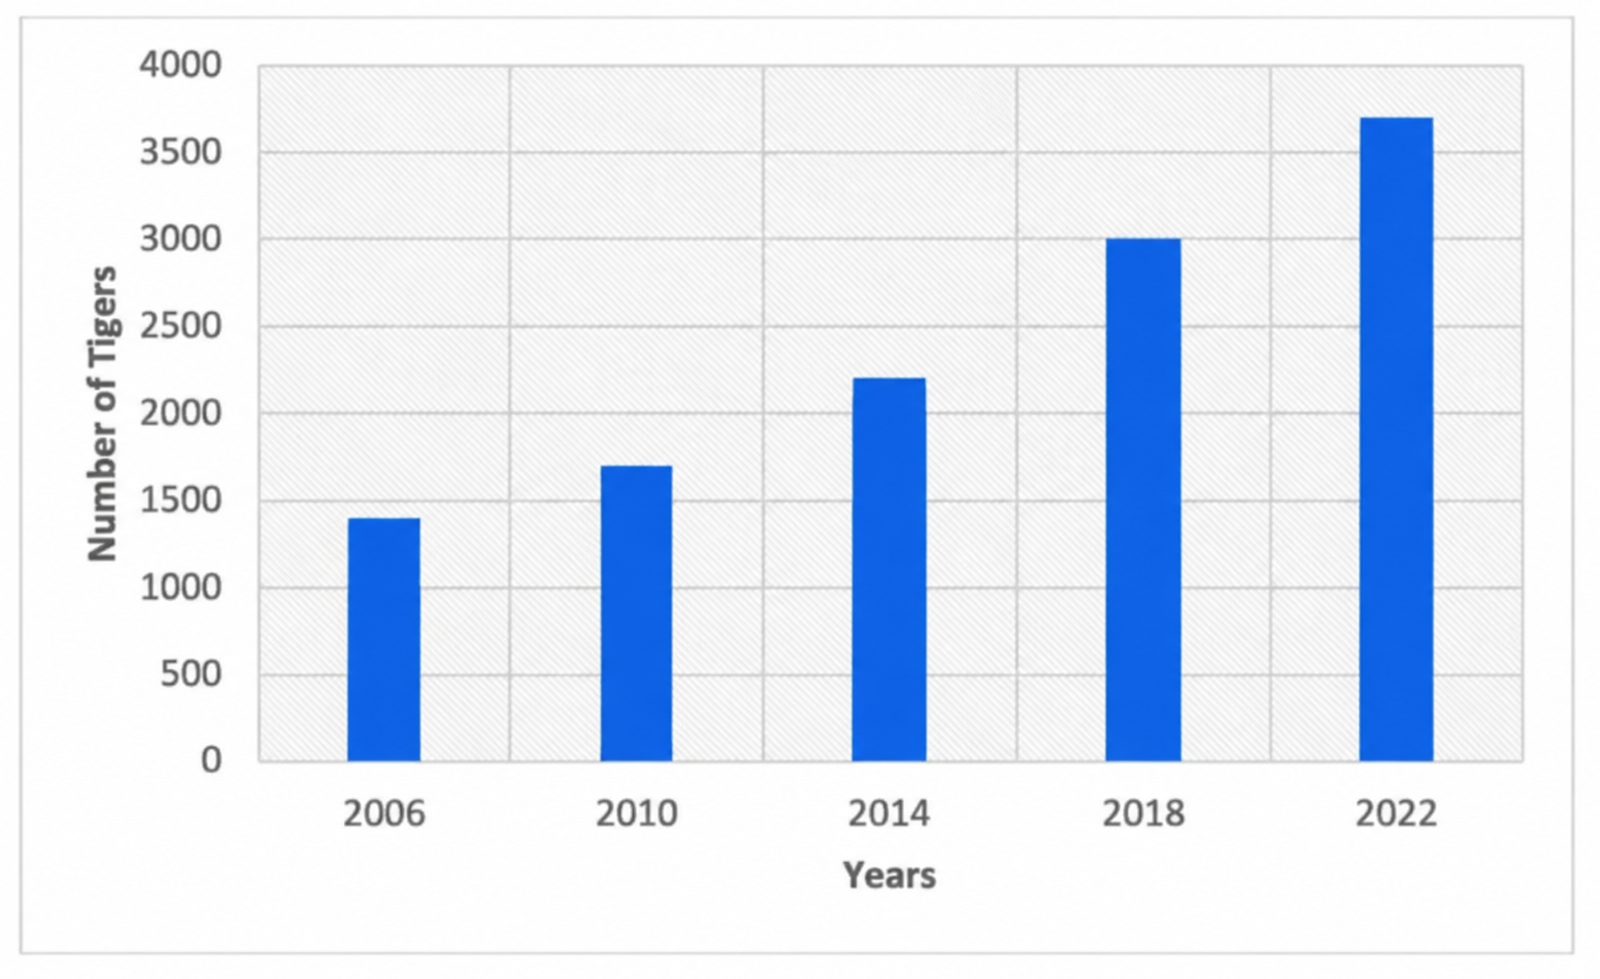
    The number of tigers in India went down drastically between 1900 and 1970. Project Tiger was launched in 1973 to track and protect the tigers in India. Starting in 2006, the exact number of tigers in India was tracked. Shagufta and Divya looked up information about the number of tigers in India between 2006 and 2022 in four-year intervals. They prepared a frequency table for this data and a bar graph to present this data, but there are a few mistakes in the graph. Can you find those mistakes and fix them?

    The bars for 2006, 2010, 2014 and 2018 need correction. Their heights must match 1400, 1700, 2200 and 3000 respectively. The 2022 bar should reach 3700.

    ”
    Pages 101–105

    4.5 Artistic and Aesthetic Considerations

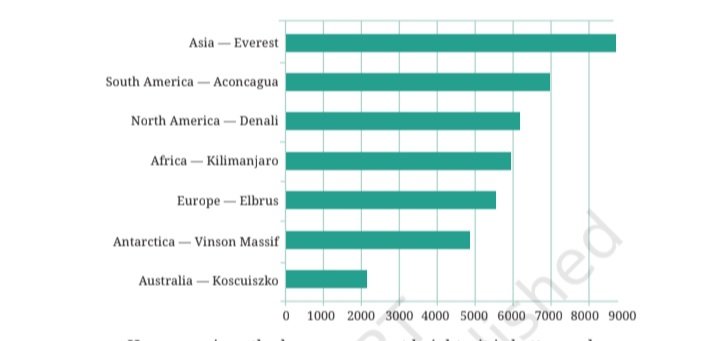
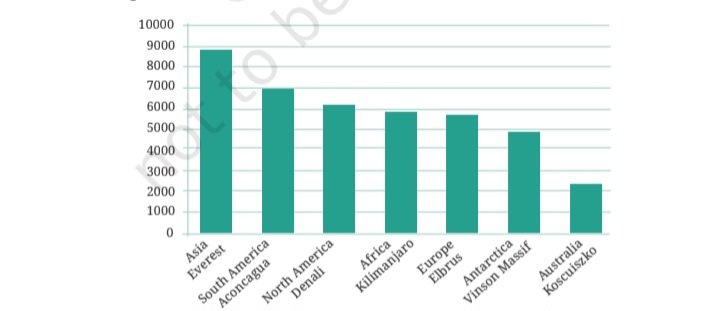
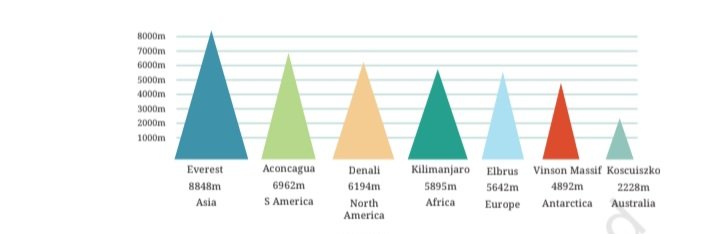
    Graphs should be attractive, but they must also be accurate. A fancy picture should never give a wrong idea about the data.
    Mountain Heights — Simple Visual

    Page 103 — Figure it Out — Q1

    If you wanted to visually represent the data of the heights of the tallest persons in each class in your school, would you use a graph with vertical bars or horizontal bars? Why?

    A vertical bar graph is useful because height naturally increases upward, making comparison easy.

    Page 103 — Figure it Out — Q2

    If you were making a table of the longest rivers on each continent and their lengths, would you prefer to use a bar graph with vertical bars or with horizontal bars? Why? Try finding out this information, and then make the corresponding table and bar graph! Which continents have the longest rivers?

    A horizontal bar graph is useful because river length is naturally compared along a horizontal direction. Both types are possible, but horizontal bars make long lengths easy to compare.

    Quick Chapter Revision

    DATA
    Collected information
    TALLY MARK
    Quick counting method
    FREQUENCY
    Number of occurrences
    PICTOGRAPH
    Data using pictures
    BAR GRAPH
    Data using equal-width bars
    SCALE
    Tells what one unit or symbol represents
    INFOGRAPHIC
    Data + attractive visuals
    Golden Rules for Graphs
    1. Choose a suitable scale.
    2. Start the scale from zero.
    3. Keep bars equal in width.
    4. Keep equal spaces between bars.
    5. Label the axes clearly.
    6. Always mention the scale.
    7. Never use attractive pictures that mislead the reader.
    Frequency = Number of times an observation occurs
    Total = Sum of all frequencies
    Pictograph value = Number of symbols × value of one symbol
    Bar height = Data value ÷ scale value

    Practice Class 6 Maths Chapter 4 with this easy and engaging worksheet. This worksheet is useful for practice, revision and exam preparation.

    CLASS 6 • MATHEMATICS

    Chapter 4 Notes & Book Solutions

    Class 6 Maths Chapter 4 Notes and Book Solutions

    Open Notes & Solutions →

    Class 6 Maths Chapter 4, Data Handling and Presentation, Class 6 Maths notes, Class 6 Maths solutions, NCERT Class 6 Maths Chapter 4, Class 6 Maths worksheet, data handling, data presentation, tables, pictographs, charts, data interpretation, Class 6 Maths questions and answers.