Class 9 Maths Chapter 10 How Quantities Combine: Understanding Data notes, NCERT solutions, easy concepts, solved questions and practice worksheet based on the new Ganita Manjari textbook 2026–27.
Chapter 10 – How Quantities Combine: Understanding Data
10.1 Combining Things
10.1.1 Average of Averages
When two or more groups are combined, we cannot always simply take the average of their averages. The size of each group must also be considered.
Combined average =
(Sum of all values) ÷ (Total number of values)
If Collection 1 has n values and average a, its total is an.
If Collection 2 has m values and average b, its total is bm.
The average of averages can be found by simply adding the averages and dividing by the number of groups only when all groups have the same size.
Example 1
In the badminton academy example, there are 8 seniors with average height 165.5 cm and 3 juniors with average height 149.33 cm.
Total height of seniors:
165.5 × 8 = 1324 cm
Total height of juniors:
149.33 × 3 ≈ 448 cm
Therefore,
≈ 161.09 cm
So the average height of the whole group is approximately 161.09 cm.
Example 2 – Cycling
Jaspreet cycled for 5 weekdays in each of 3 weeks. The weekly averages were 12.8 minutes, 15.8 minutes and 18 minutes.
Since every week has the same number of cycling days, each weekly average has equal weight.
= 46.6 ÷ 3
≈ 15.53 minutes
Therefore, the average time spent cycling per weekday is 15.53 minutes.
If all collections have equal sizes, the combined average is simply the average of the individual averages. If their sizes are different, use a weighted average.
10.1.2 Mixtures
When different mixtures are combined, the final concentration depends on both:
- the concentration of each mixture, and
- the quantity of each mixture.
Total quantity of substance ÷ Total quantity of mixture
Example 3
Two equal quantities of lemonade contain 10% and 20% jaggery.
Because the quantities are equal, the final concentration is halfway between 10% and 20%.
Answer: 15% jaggery.
Example 4
A bowl contains 500 mL lemonade with 10% jaggery. A glass contains 200 mL lemonade with 20% jaggery.
Jaggery in bowl:
500 × 0.10 = 50 mL
Jaggery in glass:
200 × 0.20 = 40 mL
Total jaggery = 90 mL
Total lemonade = 700 mL
≈ 12.86%
Answer: Approximately 12.86%.
Example 5 – Brass Alloy
Batch A = 200 kg, 70% copper.
Batch B = 120 kg, 50% copper.
Batch C = y kg, 45% copper.
Final mixture = 55% copper.
Copper in A: 200 × 0.70 = 140 kg
Copper in B: 120 × 0.50 = 60 kg
Using the concentration equation:
320 × 0.55 + 0.55y = 200 + 0.45y
176 + 0.55y = 200 + 0.45y
0.10y = 24
y = 240 kg
Therefore, Batch C weighs 240 kg.
Weighted Mean
(w₁x₁ + w₂x₂ + w₃x₃ + … + wₙxₙ) ÷ (w₁ + w₂ + w₃ + … + wₙ)
A weighted average gives more importance to values that represent larger quantities or have greater importance.
Historical Note
The weighted mean was described by Indian mathematician Brahmagupta in Brahmasphutasiddhanta around 628 CE. The idea was also used by Indian mathematicians such as Sridharacharya for problems involving purity of gold alloys.
Book Questions – Section 10.1
72 × 30 = 2160
Total score of Section B:
76 × 25 = 1900
Total score = 2160 + 1900 = 4060
Total students = 30 + 25 = 55
Combined average = 4060 ÷ 55
≈ 73.82
Answer: Approximately 73.82.
the fractions of nitrogen are
1/10, 9/50, 3/60
the fraction of nitrogen in the mixture in their average
= (1/10 + 9/50 + 3/60) ÷ 3
= (30/300 + 54/300 + 15 / 300) ÷ 3
= 99/300 ÷ 3
= 99/900
= 11/100
Answer: the fraction of nitrogen in the mixture is 11/100 .
Purity = (9 × 12 + 5 × 10 + 17 × 11) ÷ (9 + 5 + 17)
= (1088 + 50 + 187) ÷ 31
= 345 ÷ 31
= 11.129 varna
Answer: 11.13 varna.
(3.5 + 10 + 8.7) ÷ 3
= 22.2 ÷ 3
= 7.4 mm
Answer: 7.4 mm.
Spice = 100 × 0.05 + 200 × 0.10 + 300 × 0.15
= 5 + 20 + 45 = 70 mL
Total mixture = 600 mL
Concentration = 70/600 × 100
= 11.67%
(ii)
Spice = 300 × 0.05 + 200 × 0.10 + 100 × 0.15
= 15 + 20 + 15 = 50 mL
Total mixture = 600 mL
Concentration = 50/600 × 100
= 8.33%
Answers: (i) 11.67% approximately; (ii) 8.33% approximately.
10.1.3 Custom Weights
Sometimes different parts of data have different importance. We then assign weights to them.
Example 6
Rehmat scored:
- Internal tests = 60%
- Project = 64%
- Final exam = 73%
The weights are 3 : 2 : 5.
= (180 + 128 + 365) ÷ 10
= 673 ÷ 10
= 67.3%
Book Questions – Section 10.2
Internal tests: 35/50 × 100 = 70%
Project: 44/60 × 100 = 73.33%
Final exam: 80/100 × 100 = 80%
The weighted average is:
(70 × 3 + 73.33 × 4 + 80 × 5) ÷ (3 + 4 + 5)
So the correct expression is the one that first converts each score into a percentage and then applies weights 3, 4 and 5.
Answer: (iii) and (iv) are correct.
- Restaurant ratings
- Product ratings
- Examination marks
- Mixtures
- Gold purity
- Average prices
- Scientific data
Book Questions – Section 10.3
8000 × 30/100 = ₹2400
Profit from covers:
1000 × 50/100 = ₹500
Total profit = ₹2900
Total sales = ₹9000
Profit percentage:
2900/9000 × 100
≈ 32.22%
Answer: Approximately 32.22%.
20 × 44.5 = 890 km
Distance on 21st day = 55 km
Total = 890 + 55 = 945 km
Average = 945 ÷ 21
≈ 45 km
Answer: 45 km per day.
600 × 5/100 = 30 mL
Total mixture = 900 mL
Salt concentration = 30/900 × 100 = 3.33%
Sugar:
300 × 8/100 = 24 mL
Sugar concentration = 24/900 × 100 = 2.67%
Answer: Salt = 3.33%, Sugar = 2.67%.
Therefore the correct option is (v).
Required concentration = 3/4 × 8% = 6%.
Spice in 10 litres:
10 × 8/100 = 0.8 litre
Let x litres of water be added.
Total mixture = 10 + x
Required concentration:
0.8/(10+x) = 6/100
0.8 = 0.06(10+x)
0.8 = 0.6 + 0.06x
0.2 = 0.06x
x = 10/3 litres
≈ 3.33 litres
Answer: Approximately 3.33 litres of water.
Compare the changes:
Rashi: 60, 65, 70
Keerthi: 55, 65, 75
The weights are 4, 5, 6. Rashi is 5 marks higher in strength, equal in flexibility, and 5 marks lower in agility. Since agility has the largest weight, Keerthi’s advantage in agility balances and exceeds Rashi’s advantage in strength. Thus Keerthi’s weighted total is higher.
(ii) Rashi:
(60×4 + 65×5 + 70×6) ÷ 15
= (240 + 325 + 420) ÷ 15
= 985 ÷ 15
= 65.67 approximately.
Keerthi:
(55×4 + 65×5 + 75×6) ÷ 15
= (220 + 325 + 450) ÷ 15
= 995 ÷ 15
= 66.33 approximately.
Answer: Keerthi has the higher final mark.
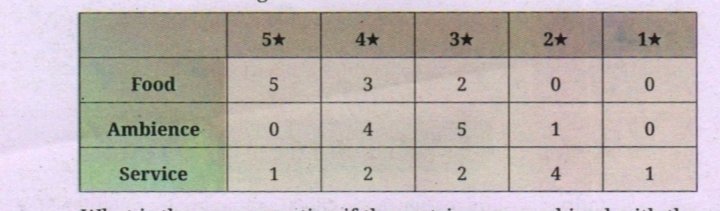
the table gives the number f costomers giving each rating
food; average = {5(5) + 3(4) + 2(3) + 0(2) + 0(1)} /10
= (25+12+6)/10 = 43/10 = 4.3
Ambience; Average = {0(5)+4(4) +5(3) +1(2)+ 0(1)} /10
= (16+15+2)/10 =3.3
Service; Average = {1(5)+2(4) +2(3) +4(2)+ 1(1)} /10
=(5+8+6+8+1)/10 = 2.8
The weights are;
Food:Ambience:service=6:5:4
therefore, combined average= {4.3(6)+3.3(5) +2.8(4)}/(6+5+4)
=(25.8+16.5=11.2)/15 = 53.5/15 = 3.57
Answer: 3.57 stars (approx.)
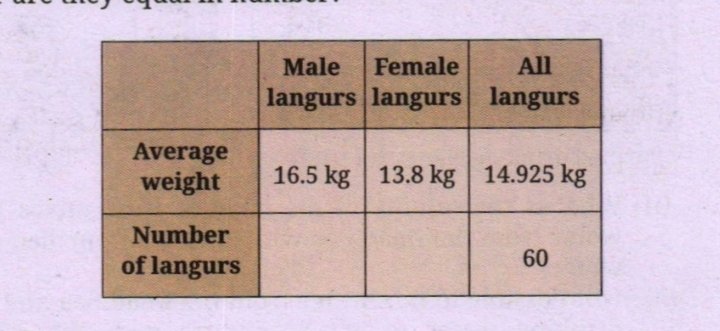
(iii) A female langur weighing 15.2 kg is admitted to the facility. What is the average weight of the female langurs after this?
(iv) Two male langurs weighing 16.9 kg and 16.1 kg are released from the facility. What is the average weight of the male langurs after this?
(v) Now, suppose one of the male langurs lost 1 kg of weight. What is the average weight of all the male langurs after this?
Average weight of female langurs = 13.8 kg
Average weight of all langurs = 14.925 kg
Total langurs = 60
Let the number of male langurs be x.
Then the number of female langurs is: 60-x
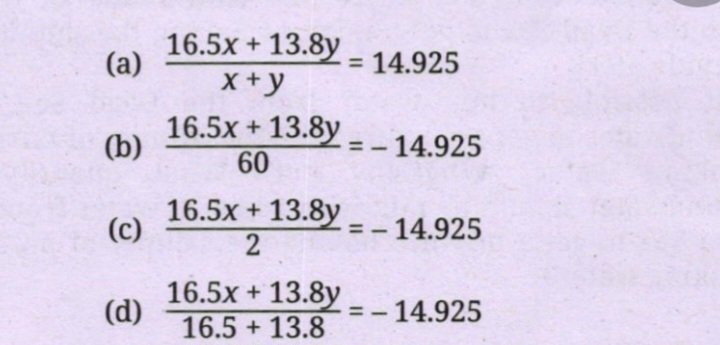
(i) Which expression describes the scenario?
The combined average is: {16.5x+13.8(60-x)}/60 =14.925
So the correct expression is:(a)
(ii) Find the number of male langurs
{16.5x+13.8(60-x)}/60 =14.925
Multiply by 60:
16.5x+13.8(60-x)=14.925(60)
16.5x+828-13.8x=895.5
2.7x=67.5
x=25
Therefore,25 male langurs Female langurs:60-25=35 (iii) A female langur weighing 15.2 kg is admitted
There were 35 female langurs.
Original total weight: 35(13.8)=438kg
After adding the new langur: 483+15.2=498.2 kg
Number of female langurs: 35+1=36
New average: 498.2/36 = 13.838
Therefore,13.84 (approx.)
(iv) Two male langurs weighing 16.9 kg and 16.1 kg are released
Original number of male langurs = 25.
Original total weight: 25(16.5)=412.5 kg
Weight released: 16.9+16.1=33 kg
Remaining total weight: 412.5-33=379.5 kg
Remaining number: 25-2=23
New average:379.5/23=16.5
Therefore,16.5 kg
(v) One male langur loses 1 kg
After part (iv):
Number of male langurs = 23
Total weight = 379.5 kg
One langur loses 1 kg: 379.5-1=378.5 kg
New average: 378.5/23 = 16.4565
Therefore, 16.46 kg (approx.)
Answer:7(i)(a)
7(ii) 25 male langurs
7(iii) 13.84 kg
7(iv) 16.5 kg
7(v) 16.46 kg
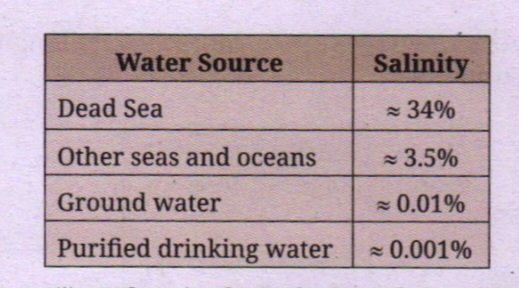
(i) What is the salinity of the mixture if he mixes 1 litre of water from the Dead Sea with 2 litres of purified drinking water?
(ii) Is it possible to mix water from the Dead Sea and purified drinking water to get a mixture with the salinity of groundwater? Why/Why not? What quantity of purified drinking water should Dorjee mix with 1 litre of water from the Dead Sea to get a mixture having the salinity of groundwater?
(iii) Is it possible to mix water from the Dead Sea and groundwater to get a mixture with the salinity of purified drinking water? Why/Why not? What quantity of groundwater should he mix with 1 litre of water from the Dead Sea to get a mixture having the salinity of purified drinking water?
Dead Sea water:1×34=34
Purified drinking water: 2×0.001=0.002
Total salt percentage contribution: 34+0.002=34.002
Total quantity of water:1+2=3 litres
Therefore,
salinity=34.002/3=11.334%
(ii)
Groundwater salinity is:0.01%
Let x litres of purified drinking water be mixed with 1 litre of Dead Sea water.
Then: (34×1+0.001x)/(1+x)=0.01
34+0.001x=0.01+0.01x
33.99=0.009x
x=33.99/0.009
x=3776.67
Therefore, He should mix: 3776.67 litres of purified drinking water with 1 litre of Dead Sea water.
(iii)
Here: Dead Sea water = 34
Groundwater = 0.01
Required salinity =0.001% < 0.01% < 34%
The lowest salinity available among the two waters being mixed is already 0.01.
Therefore, their mixture cannot have a salinity lower than 0.01.
So it is not possible to obtain 0.001.
Therefore, there is no quantity of groundwater that can be mixed with 1 litre of Dead Sea water to obtain the salinity of purified drinking water.
10.2.1 Stacking Columns
A stacked bar chart joins different parts of a total into one bar. It allows us to see both the total and the parts making up the total.
10.2 Visualising and Interpreting Data
Table 10.2 – Average Weekly Expenditure
| Family | Housing | Food | Transportation | Healthcare | Education | Recreation |
|---|---|---|---|---|---|---|
| Family A | 1940 | 1700 | 1280 | 1200 | 1770 | 535 |
| Family B | 1750 | 1546 | 1500 | 1280 | 1210 | 0 |
| Family C | 950 | 1700 | 1540 | 1400 | 1300 | 150 |
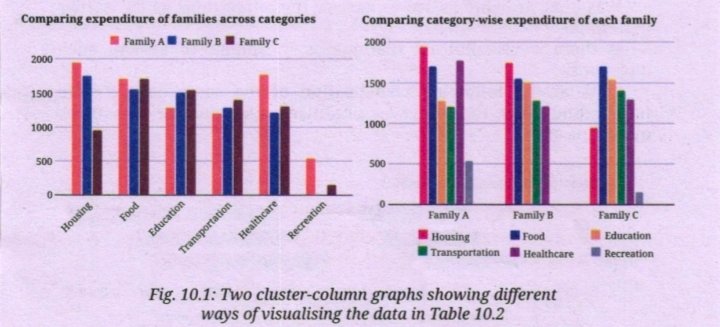
Family A = ₹1940
Family B = ₹1750
Family C = ₹950
Answer: Family C.
Family B = ₹1280
Family C = ₹1400
Answer: Family C.
Answer: Approximately ₹1770.
₹1750.
Answer: Housing.
Healthcare = ₹1200
Therefore, Family A spent more on food.
Answer: Food.
1940 + 1700 + 1280 + 1200 + 1770 + 535 = ₹8425
Family B total:
1750 + 1546 + 1500 + 1280 + 1210 + 0 = ₹7286
Family C total:
950 + 1700 + 1540 + 1400 + 1300 + 150 = ₹7040
Answer: Family C.
950 + 1700 + 1540 + 1400 + 1300 + 150
= ₹7040
Answer: Approximately ₹7040.
Total = ₹7040
Percentage:
950/7040 × 100
≈ 13.5%
Answer: Approximately 13.5%.
Cluster-column charts are useful when we want to compare individual categories or groups. Stacked charts are useful when we also want to compare totals.
Stacked Bar Chart
In a stacked bar chart, the complete length of a bar represents the total. The smaller sections represent the components of that total.
IUCN Red List – Stacked Column Chart
Book Questions – Section 10.4
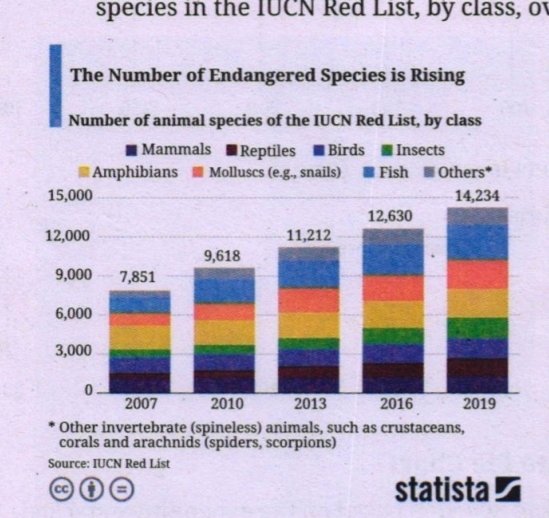
Answer: The total represented animal species in the 2019 column.
Answer: approximately 1500 species
Answer: reptiles, amphibians and others.

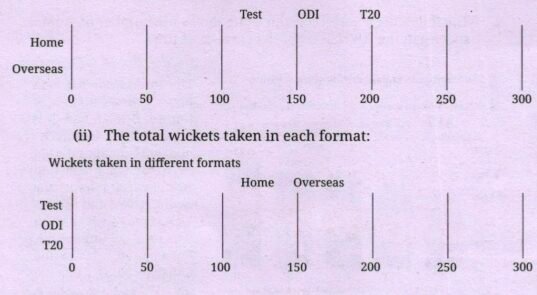
So, total wickets at home:=194
Overseas:172+49+71=292
So, total wickets overseas: 292
For the stacked bar chart, draw:
Home: Test = 62, then ODI = 100, then T20 = 32 → total 194
Overseas: Test = 172, then ODI = 49, then T20 = 71 → total 292
Thus, the two bars should end approximately at 194 and 292 respectively.
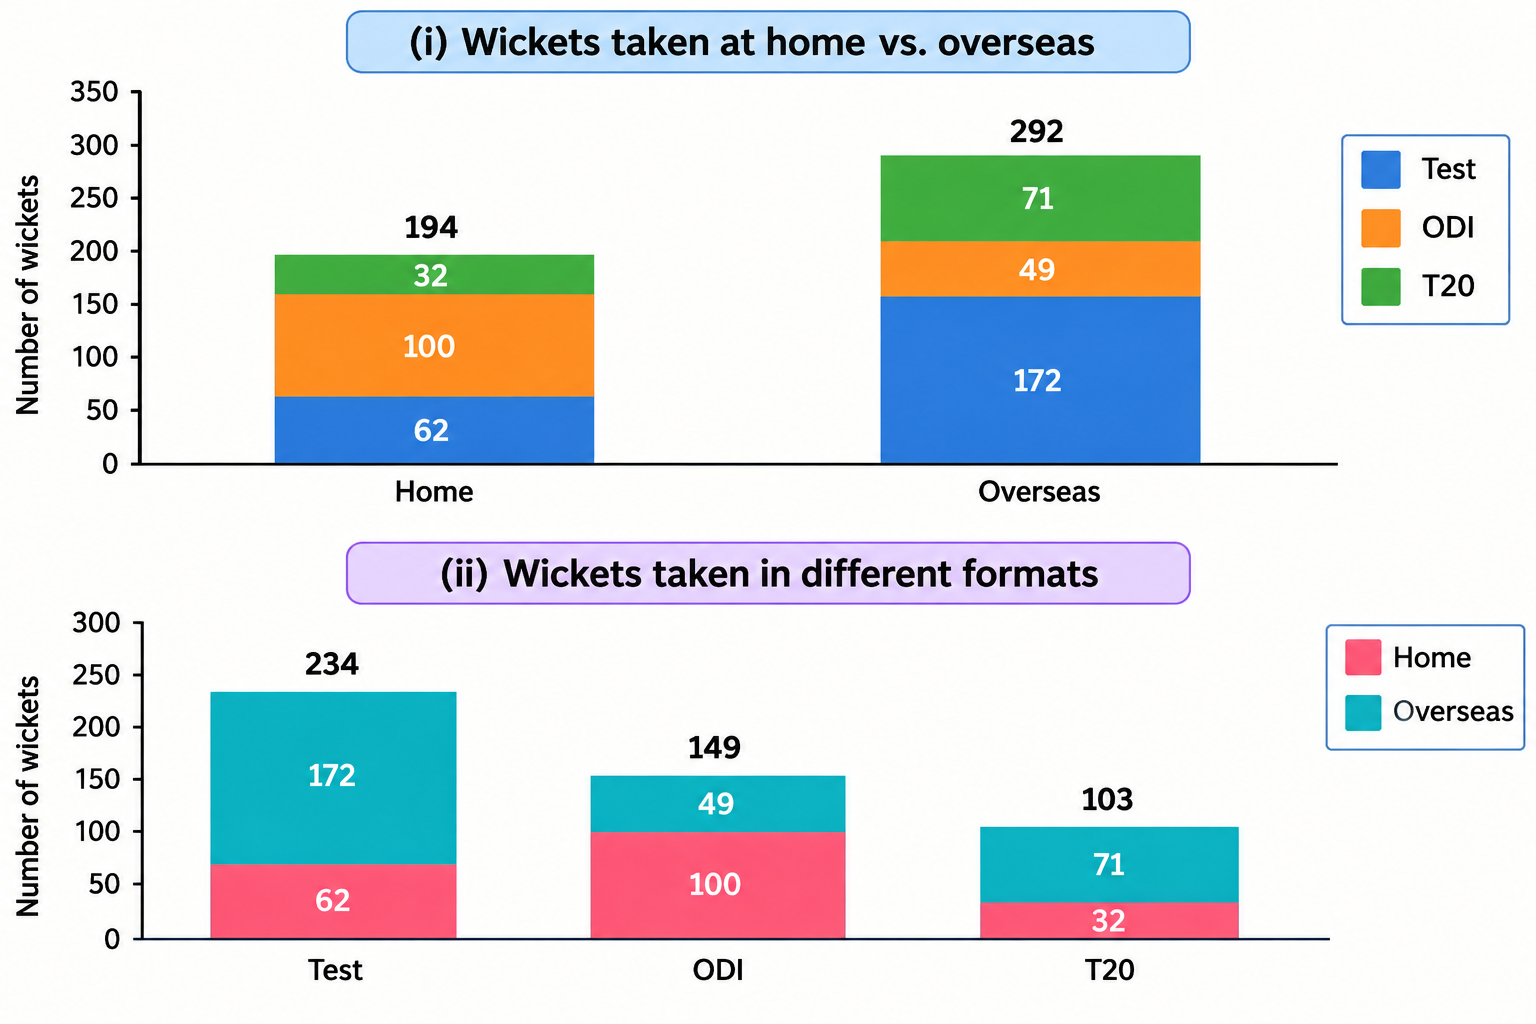
ii) Total wickets taken in each format
Now add Home + Overseas for each format.
Test 62+172=234
ODI 100+49=149
T20 32+71=103
For the second stacked bar chart:
Test: Home = 62, Overseas = 172 → total 234
ODI: Home = 100, Overseas = 49 → total 149
T20: Home = 32, Overseas = 71 → total 103
10.2.2 An Alternative to Pie Chart

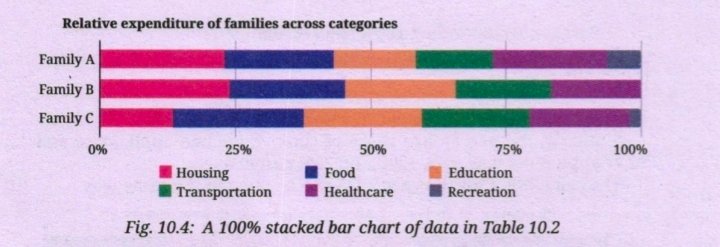
Family A: 1200/8425 × 100 ≈ 14.24%
Family B: 1280/7286 × 100 ≈ 17.57%
Family C: 1400/7040 × 100 ≈ 19.89%
Therefore, the smallest share is for Family A.
A 100% stacked bar chart tells us about proportions, not actual totals.
If one bar has 60% of something and another has 40%, we cannot know which has more actual objects unless we know their total quantities.
Think and Reflect
- total quantities,
- individual components, and
- parts of each total.
- percentage shares,
- proportions within each total, and
- how the composition of different totals differs.
A Typical Day
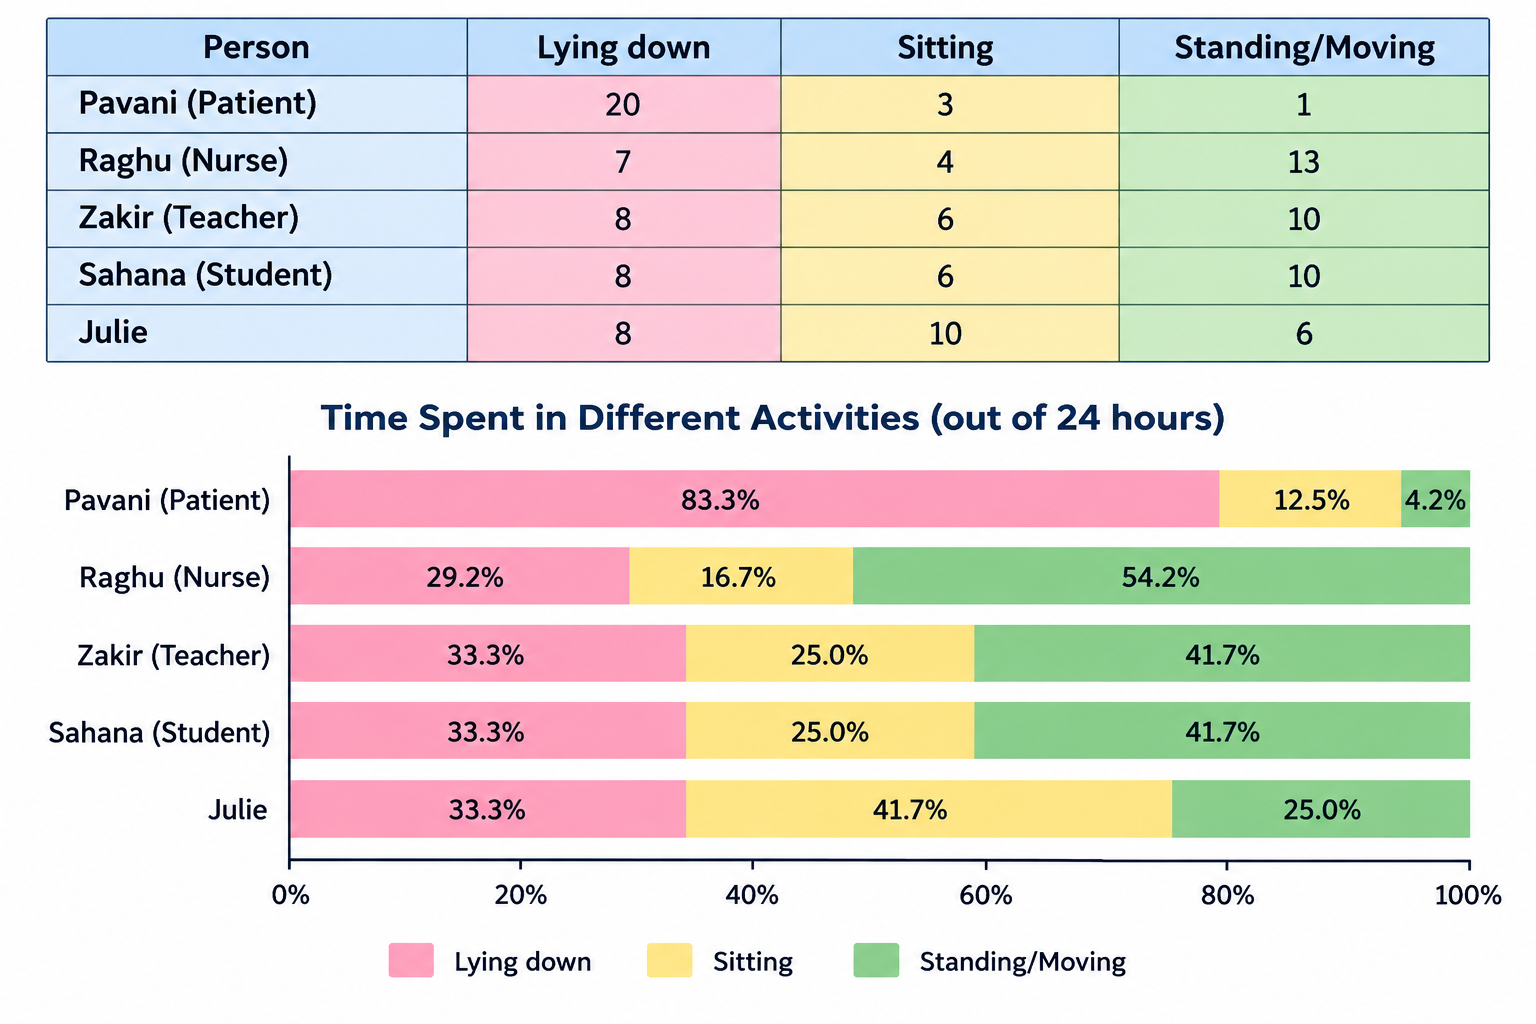
A 100% stacked bar chart can also represent how a fixed total time of 24 hours is divided among different activities.
Book Exercise – Section 10.5
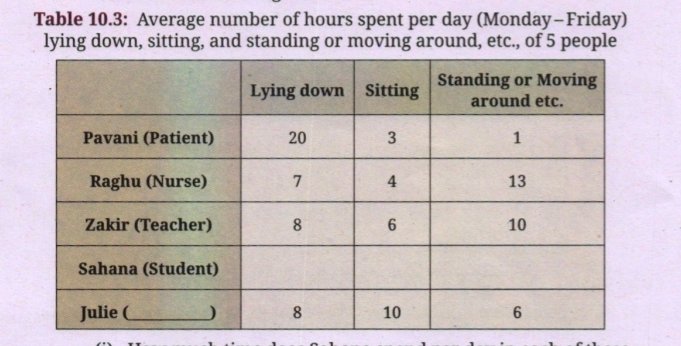
(i) How much time does Sahana spend per day in each of these body-states? Make a reasonable guess and fill her row in the table.
(ii) Guess what activity or work Julie could be engaged in based on the data. Find out what your classmates’ guesses are.
(iii) Complete the chart below based on the tabular data.
The question asks for a reasonable guess. One reasonable choice is: Lying down = 8 hours
Sitting = 6 hours
Standing or moving around = 10 hours
Check: 8+6+10=24 hrs.
So Sahana’s row can be filled as:
Lying down 8 hrs.
Sitting 6hrs.
Standing or Moving around etc. 10 hrs.
(ii)
Julie spends:
8 hours lying down
10 hours sitting
6 hours standing or moving around
Since she spends a large amount of time sitting and some time moving around, she could be engaged in office or desk-based work, such as an office worker, accountant, or computer professional.
This is only a reasonable guess based on the data. julie could be an office/desk based worker.
(iii)
End-of-Chapter Exercises
Cricket Run Rate
Total runs = 6 + 12 = 18
Overs = 2
Run rate = 18 ÷ 2 = 9 runs per over.
(ii)
After 19 overs, runs = 19 × 6 = 114.
Last over = 12 runs.
Total = 126 runs.
Run rate = 126 ÷ 20 = 6.3 runs per over.
Srikanth: 194(N), 85(N), 93(N), 121(N)
Kashvi: 49(N), 297(F), 105(N), 275(F), 40(N)
Prasanna: 124(N), 333(F), 182(N), 258(F)
Gracy: 220(F), 458(F), 129(F), 183(N)
Can you describe a way they can work together to find the average price of a shuttlecock across types?
(i) Each one calculated the average of the prices they had gathered. Suppose these are a₁, a₂, a₃, a₄, a₅ respectively. Write an expression that gives the combined average.
(ii) Suppose aₙ and aₓ are the average prices of the nylon shuttlecocks and the feather shuttlecocks, respectively. Write an expression that gives the average price of a shuttlecock. Will this be equal to the answer we got using the method in the previous part?
The five individual averages cannot simply be added and divided by 5 unless all five friends collected the same number of prices.
Yusuf collected 6 prices.
Srikanth collected 4 prices.
Kashvi collected 5 prices.
Prasanna collected 4 prices.
Gracy collected 4 prices.
Total number of prices = 6 + 4 + 5 + 4 + 4 = 23
the numbers of observations collected are 6, 4, 5, 4 and 4, then:
Combined average = (6a₁ + 4a₂ + 5a₃ + 4a₄ + 4a₅) ÷ 23
(ii)
Number of nylon shuttlecocks = 13
Number of feather shuttlecocks = 10
Total number of shuttlecocks = 23
Therefore, the average price is:
Average = (13aₙ+ 10aₓ) ÷ 23
Yes, this will be equal to the answer obtained in part (i), because both methods consider all 23 prices. Overall average price: 4063 / 23 = 176.65
Therefore, the average price of a shuttlecock is approximately: ₹176.65
Original value = 25 × ₹150 = ₹3750
New purchase = 10 × ₹30 = ₹300
Total value = ₹4050
Total shares = 35
Average = 4050 ÷ 35
≈ ₹115.71
(ii)
Original value = 5 × 150 = ₹750
Let the number of new shares be x.
New value = 30x
New total shares = 5+x
Average is ₹70:
(750 + 30x)/(5+x) = 70
750 + 30x = 350 + 70x
400 = 40x
x = 10
Answer: 10 shares.
Mean depth = (4×9 + 5×7 + 6×7 + 7×3 + 8×2) ÷ (4+5+6+7+8)
= (36 + 35 + 42 + 21 + 16) ÷ 30
= 150 ÷ 30
= 5 hastas
Answer: 5 hastas.

(i) Purchase 1g gold at ₹30k
(ii) Purchase 2g gold at ₹30k
(iii) Purchase 1g gold at ₹10k
(iv) Purchase 10g gold at ₹10k
(v) Purchase 0.5g gold at ₹30k
(vi) Purchase 0.5g gold at ₹15k
(i)
(15 + 30) ÷ 2 = ₹22.5k
(ii)
(15 + 2×30) ÷ 3
= 75/3
= ₹25k
(iii)
(15 + 10) ÷ 2
= ₹12.5k
(iv)
(15 + 10×10) ÷ 11
= 115/11
≈ ₹10.45k
(v)
(15 + 0.5×30) ÷ 1.5
= 30/1.5
= ₹20k
(vi)
Both purchases are at ₹15k per gram.
Therefore the average remains ₹15k.
W = (w₁x₁ + w₂x₂ + … + wₙxₙ)/(w₁+w₂+…+wₙ)
If every weight is doubled:
W’ = (2w₁x₁ + 2w₂x₂ + … + 2wₙxₙ)/ (2w₁+2w₂+…+2wₙ)
Taking 2 common from numerator and denominator:
W’ = 2N/2D = N/D = W.
Answer: The weighted average does not change.
(i)From the graph, in 2003 the total number of objects was approximately:10,000
Double of 10,000 is:20,000
The graph reaches approximately 20,000 objects around 2021.
Answer: about 10,000 objects in 2003. it doubled around 2021.
(ii) rom the graph for 2025:
Payload objects ≈ 17,500
Other objects ≈ 15,500
Total ≈ 33,000
Share of payload objects; (17,000/33,000)×100 ≈ 53%
Share of other objects (15,500/33,000)×100 ≈ 47%
(iii) Number of payload objects: The number of payload objects increases over time. The increase becomes particularly rapid after about 2020.
Number of other objects:
The number of other objects also increases over time, but its increase is more gradual compared with payload objects.
Shares over time:
Earlier, other objects made up a larger share of the total. In recent years, the share of payload objects has increased considerably, while the share of other objects has decreased relatively.
Answer: Exact values require the textbook graph.
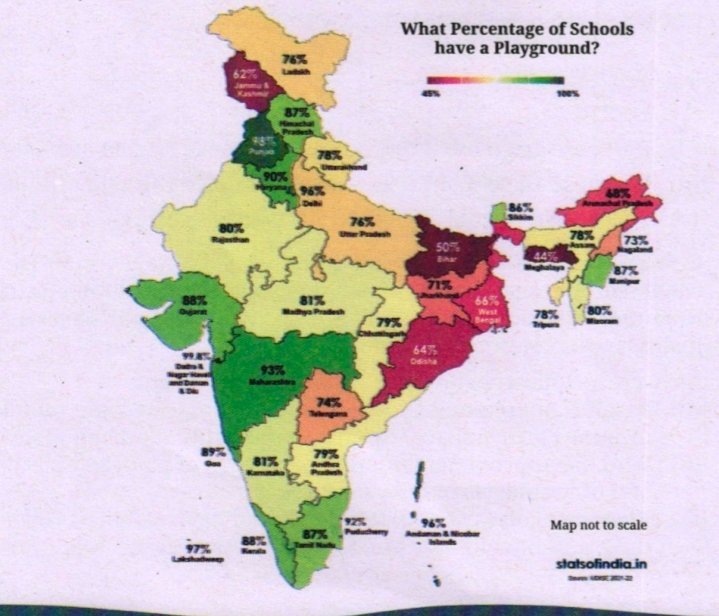
(i) Identify the correct inference(s) from the statements given.
(a) More schools have a playground in Haryana compared to Uttarakhand.
(b) Approximately every 2 out of 3 schools in Arunachal Pradesh have a playground.
(c) Punjab has the highest number of schools with a playground.
(d) Suppose it is given that Maharashtra has more schools than Telangana. Then the number of schools having a playground is more in Maharashtra.
(ii) Using the information given, can we find the nation-wide percentage of schools with a playground? If not, what additional information is needed?
The map gives the percentage of schools having a playground in each state/UT. It does not give the actual number of schools.
(a) More schools have a playground in Haryana compared to Uttarakhand.
The map gives percentages, not the total number of schools. Therefore, we cannot compare the actual number of schools having playgrounds.
Incorrect.
(b) Approximately every 2 out of 3 schools in Arunachal Pradesh have a playground.
Arunachal Pradesh has approximately 48% of schools with playgrounds, not about 67%.
Incorrect.
(c) Punjab has the highest number of schools with a playground.
Again, only percentages are given. The total number of schools in each state is not given.
Incorrect.
(d) Suppose it is given that Maharashtra has more schools than Telangana. Then the number of schools having a playground is more in Maharashtra.
Maharashtra has about 93% of schools with playgrounds, while Telangana has about 74%. Since Maharashtra also has more schools, the number of schools with playgrounds must be greater in Maharashtra. Correct.
Answer: only d
(ii)
No, we cannot find it from the given information alone.
The map gives the percentage for each state, but we do not know the total number of schools in each state.
To calculate the nation-wide percentage, we would need the number of schools in each state/UT.
The calculation would be: Nation-wide percentage = (Total number of schools having playgrounds / Total number of schools) × 100
So, the additional information needed is:The total number of schools in each state/UT.
9. Decision Dilemma
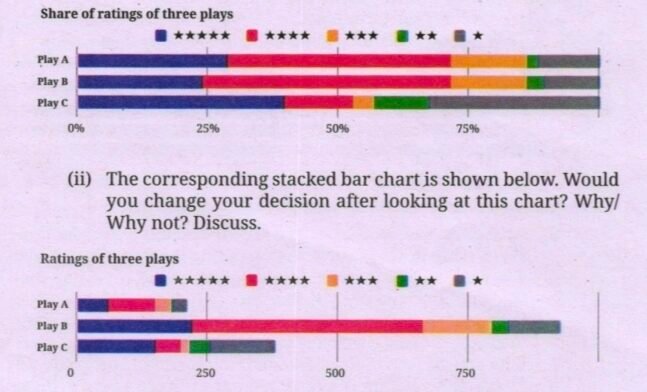
From the chart, Play A has a large proportion of 4-star and 5-star ratings and a relatively small proportion of low ratings.
So, based only on the distribution of ratings, one could choose:Answer: Play A.
Play B has received far more ratings than Play A and Play C. Therefore, the first chart can be misleading if we consider only percentages, because all three bars in the first chart have been made the same length.
However, if we are choosing based specifically on the average rating, the proportions of the ratings should be considered. Play A still has a slightly higher average rating than Play B based on the approximate values in the chart.
Therefore, the two charts provide different information:
First chart: compares the distribution/share of ratings.
Second chart: compares the actual number of ratings.
Play B: has many more total ratings.
Play A: has a slightly higher average rating based on the approximate distribution.
Conclusion: The second chart may affect the decision because it shows that Play B has a much larger number of ratings, but the choice depends on whether we value the rating distribution or the number of ratings received.
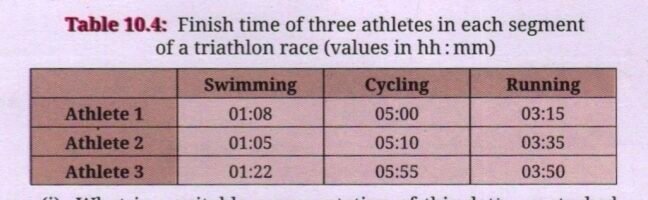
(i) What is a suitable representation of this data-a stacked bar chart or a 100% stacked bar chart? Why do you think so?
(ii) Suppose a 100% stacked bar chart is drawn. Which of the following question(s) can be answered by looking at just that chart?
(a) Who finished the race first?
(b) Approximately what fraction of their race time did Athlete 1 spend cycling?
(c) Which athlete took the longest for running?
A 100% stacked bar chart is more suitable.
Reason: The total race time is different for the three athletes. A 100% stacked bar chart makes each athlete’s total equal to 100%, so we can compare the fraction/percentage of time spent in swimming, cycling and running.
(ii)
A 100% stacked chart shows fractions of total race time. Therefore:
(a) Who finished first? A 100% stacked bar chart shows proportions, not the actual total time. Although Athlete 1’s total time is actually the least (9 h 23 min), this cannot be determined from the 100% chart alone.
No.
(b) Fraction of race time spent cycling? Yes.
(c) Who took the longest actual time for running? No.
Answer: Only (b).
1) The graph divides people into four age groups: 0–19, 20–39, 40–59, and 60 years & above. Movement disability forms a significant portion in all age groups.
2) In the 60 years & above group, the proportions of seeing, hearing and movement disabilities appear relatively large.
3) Speech disability occupies a smaller portion compared with seeing, hearing and movement disabilities.
4) Multiple disabilities are present in every age group.
5) The proportion of seeing disability is noticeably higher in the 60+ group than in the younger groups. The proportion of movement disability is also quite large, particularly among the older age groups.
What do I wonder?
1) Why do seeing and movement disabilities become more prominent with increasing age?
2) Why is speech disability a relatively small proportion in all age groups?
3) What causes the differences in types of disabilities among different age groups?
4) How have these figures changed since the 2011 Census?
Inferences
1) Age appears to be associated with the distribution of different types of disabilities, particularly seeing and movement disabilities.
2) Older people have a relatively larger share of seeing and movement disabilities.
3) Disability is not of one type; there is considerable variation in the type of disability across age groups.
4) Multiple disabilities occur in all four age groups. The graph shows proportions within each age group, not the actual total number of disabled persons in each age group.
(i) Recall the previous day and fill in the approximate time spent lying down, sitting, and standing/moving around, etc. Ask at least 2 of your family members about their day and fill it in. Alternatively, you can choose to track just your own body-state for any one of the weekdays, Saturday, and Sunday. Visualise it using a stacked bar chart. Discuss with your class how you arrived at the estimated time spent in each state.
A good procedure is:
- Record the number of hours spent in each body-state.
- Make sure the total is approximately 24 hours.
- Draw one stacked bar for each person/day.
- Label each section.
- Compare the patterns and write observations.
- Food
- Housing
- Education
- Transport
- Healthcare
- Entertainment
- Other expenses
Percentage = category expenditure ÷ total expenditure × 100.
Then draw a 100% stacked bar for each month.
- Which category takes the largest share.
- Which category takes the smallest share.
- Whether the shares change from month to month.
- Which expenses remain almost constant.
- Which expenses vary significantly.
Small-Group Project
- Comfort – weight 4
- Cleanliness – weight 3
- Safety – weight 5
- Timeliness – weight 3
Weighted rating = Σ(weight × rating) ÷ Σ weights
Then find the average of the 10 individual weighted ratings.
- Which aspect received the highest contribution.
- Which aspect received the lowest contribution.
- Whether the rating system gives a realistic overall picture.
- Which important factors may not have been included.
Whole Class Project
If family i has average age aᵢ and nᵢ members, its total age is aᵢnᵢ.
Therefore:
Overall average = Σ(aᵢnᵢ) ÷ Σnᵢ
This is a weighted average.
Original:
W = Σwᵢxᵢ / Σwᵢ
New:
W’ = Σ(wᵢ+1)xᵢ / Σ(wᵢ+1)
= [Σwᵢxᵢ + Σxᵢ] / [Σwᵢ+n]
This is generally not equal to W.
Answer: Adding the same constant to every weight generally changes the weighted average.
Farm Animals – Shares of Population
(i) % of cows decreased, % of sheep decreased, % of chickens decreased
(ii) % of cows increased, % of sheep increased, % of chickens increased
(iii) % of cows remained the same, % of sheep remained the same, % of chickens remained the same
(iv) % of cows decreased, % of sheep increased, % of chickens remained the same
(v) % of cows increased, % of sheep increased, % of chickens decreased.
(i) Not possible because all three shares cannot decrease and still total 100%.
(ii) Not possible because all three cannot increase and total 100%.
(iii) Possible. All three populations may decrease by the same proportion, so their shares remain unchanged.
(iv) Possible. One share can decrease, another can increase, while the third remains unchanged.
(v) Possible. Two shares can increase while one decreases, with the total remaining 100%.
Answer: (iii), (iv) and (v) are possible.
Chapter Summary
x̄ = (w₁x₁ + w₂x₂ + w₃x₃ + … + wₙxₙ) ÷ (w₁ + w₂ + w₃ + … + wₙ)
Key Points to Remember
- An average of averages must take the sizes of the groups into account.
- If all groups have equal sizes, their averages can be averaged directly.
- For mixtures, larger quantities have greater influence on the final concentration.
- A weighted average is used when different values have different importance.
- Weighted averages are useful for marks, ratings, mixtures, prices and many other situations.
- If all weights are multiplied by the same positive number, the weighted average does not change.
- If the same number is added to every weight, the weighted average generally changes.
- A stacked bar chart shows totals as well as their components.
- A 100% stacked bar chart shows proportions or percentages.
- A 100% stacked bar chart does not show actual totals unless additional information is provided.
- A stacked bar chart can be converted into a 100% stacked bar chart by calculating percentages.
- A 100% stacked bar chart cannot be converted into an ordinary stacked bar chart unless the actual totals are known.
Quick Revision
| Concept | Remember |
|---|---|
| Average | Total ÷ Number of values |
| Combined average | Total of all groups ÷ Total number of values |
| Weighted average | Σ(wx) ÷ Σw |
| Mixture concentration | Total substance ÷ Total mixture |
| Stacked bar chart | Shows totals and components |
| 100% stacked bar chart | Shows proportions/percentages |
Whenever you see words such as different group sizes, importance, weightage, concentration, quantity, contribution, rating, marks or purity, think about a weighted average.
prepare more with the given Worksheet, which will help you to improve your knowledge .
Class 9 Maths Part 2 Chapter 10 Notes, Class 9 Maths Chapter 10 Notes, Class 9 Ganita Manjari Chapter 10 Notes, Class 9 Maths Part 2 Chapter 10 Book Solutions, Class 9 Maths Chapter 10 Book Solutions, Class 9 Ganita Manjari Chapter 10 Book Solutions, Class 9 Maths Chapter 10 Questions and Answers, Class 9 Maths Chapter 10 Understanding Data Notes, Class 9 Ganita Manjari Chapter 10 Understanding Data, Class 9 Maths Chapter 10 How Quantities Combine Understanding Data, NCERT Class 9 Maths Chapter 10 Notes, CBSE Class 9 Maths Chapter 10 Notes, Class 9 Maths Chapter 10 Study Material, Class 9 Maths Chapter 10 Revision Notes