Class 8 Social Science Part 2 Chapter 6 – Dynamics of Population from the new NCERT textbook Exploring Society: India and Beyond. Get easy Notes and complete Book Solutions with important concepts, questions and answers, and revision material for effective learning, practice and exam preparation.
Dynamics of Population
Chapter 6 • Economic Life Around Us
— Ban Ki-moon
🌍 Complete Chapter Notes • 📊 Easy Concepts • 👨👩👧 Population Trends • 📈 Demographic Transition • 🧑💼 Demographic Dividend • 📚 All Book Questions with Easy Answers
📚 Chapter Navigator
🌟 The Big Questions
📝 Chapter in Short
👨👩👧 Demography
Demography is the study of the size, structure, composition and changes in human population.
👶 Birth & Fertility
Birth rate tells us how many babies are born. Fertility rate tells us the average number of children a woman has during her lifetime.
⚰️ Mortality
Mortality or death rate tells us about deaths in a population. Better healthcare usually lowers mortality.
🚶 Migration
Migration means movement of people from one place to another for work, education, safety or other reasons.
📊 Population Pyramid
It shows the distribution of people according to age and gender.
💼 Demographic Dividend
A large working-age population can provide an opportunity for faster economic growth.
🌍 1. What Is Demography?
The human population is spread across the world. People differ in age, gender, education, occupation, religion and many other ways. These characteristics also change with time.
🔑 Three Main Parts of Demography
🏫 Why Do Governments Study Population?
Population information helps governments plan:
- Schools and colleges
- Hospitals and healthcare
- Roads and transport
- Housing
- Water and electricity
- Waste management
- Employment opportunities
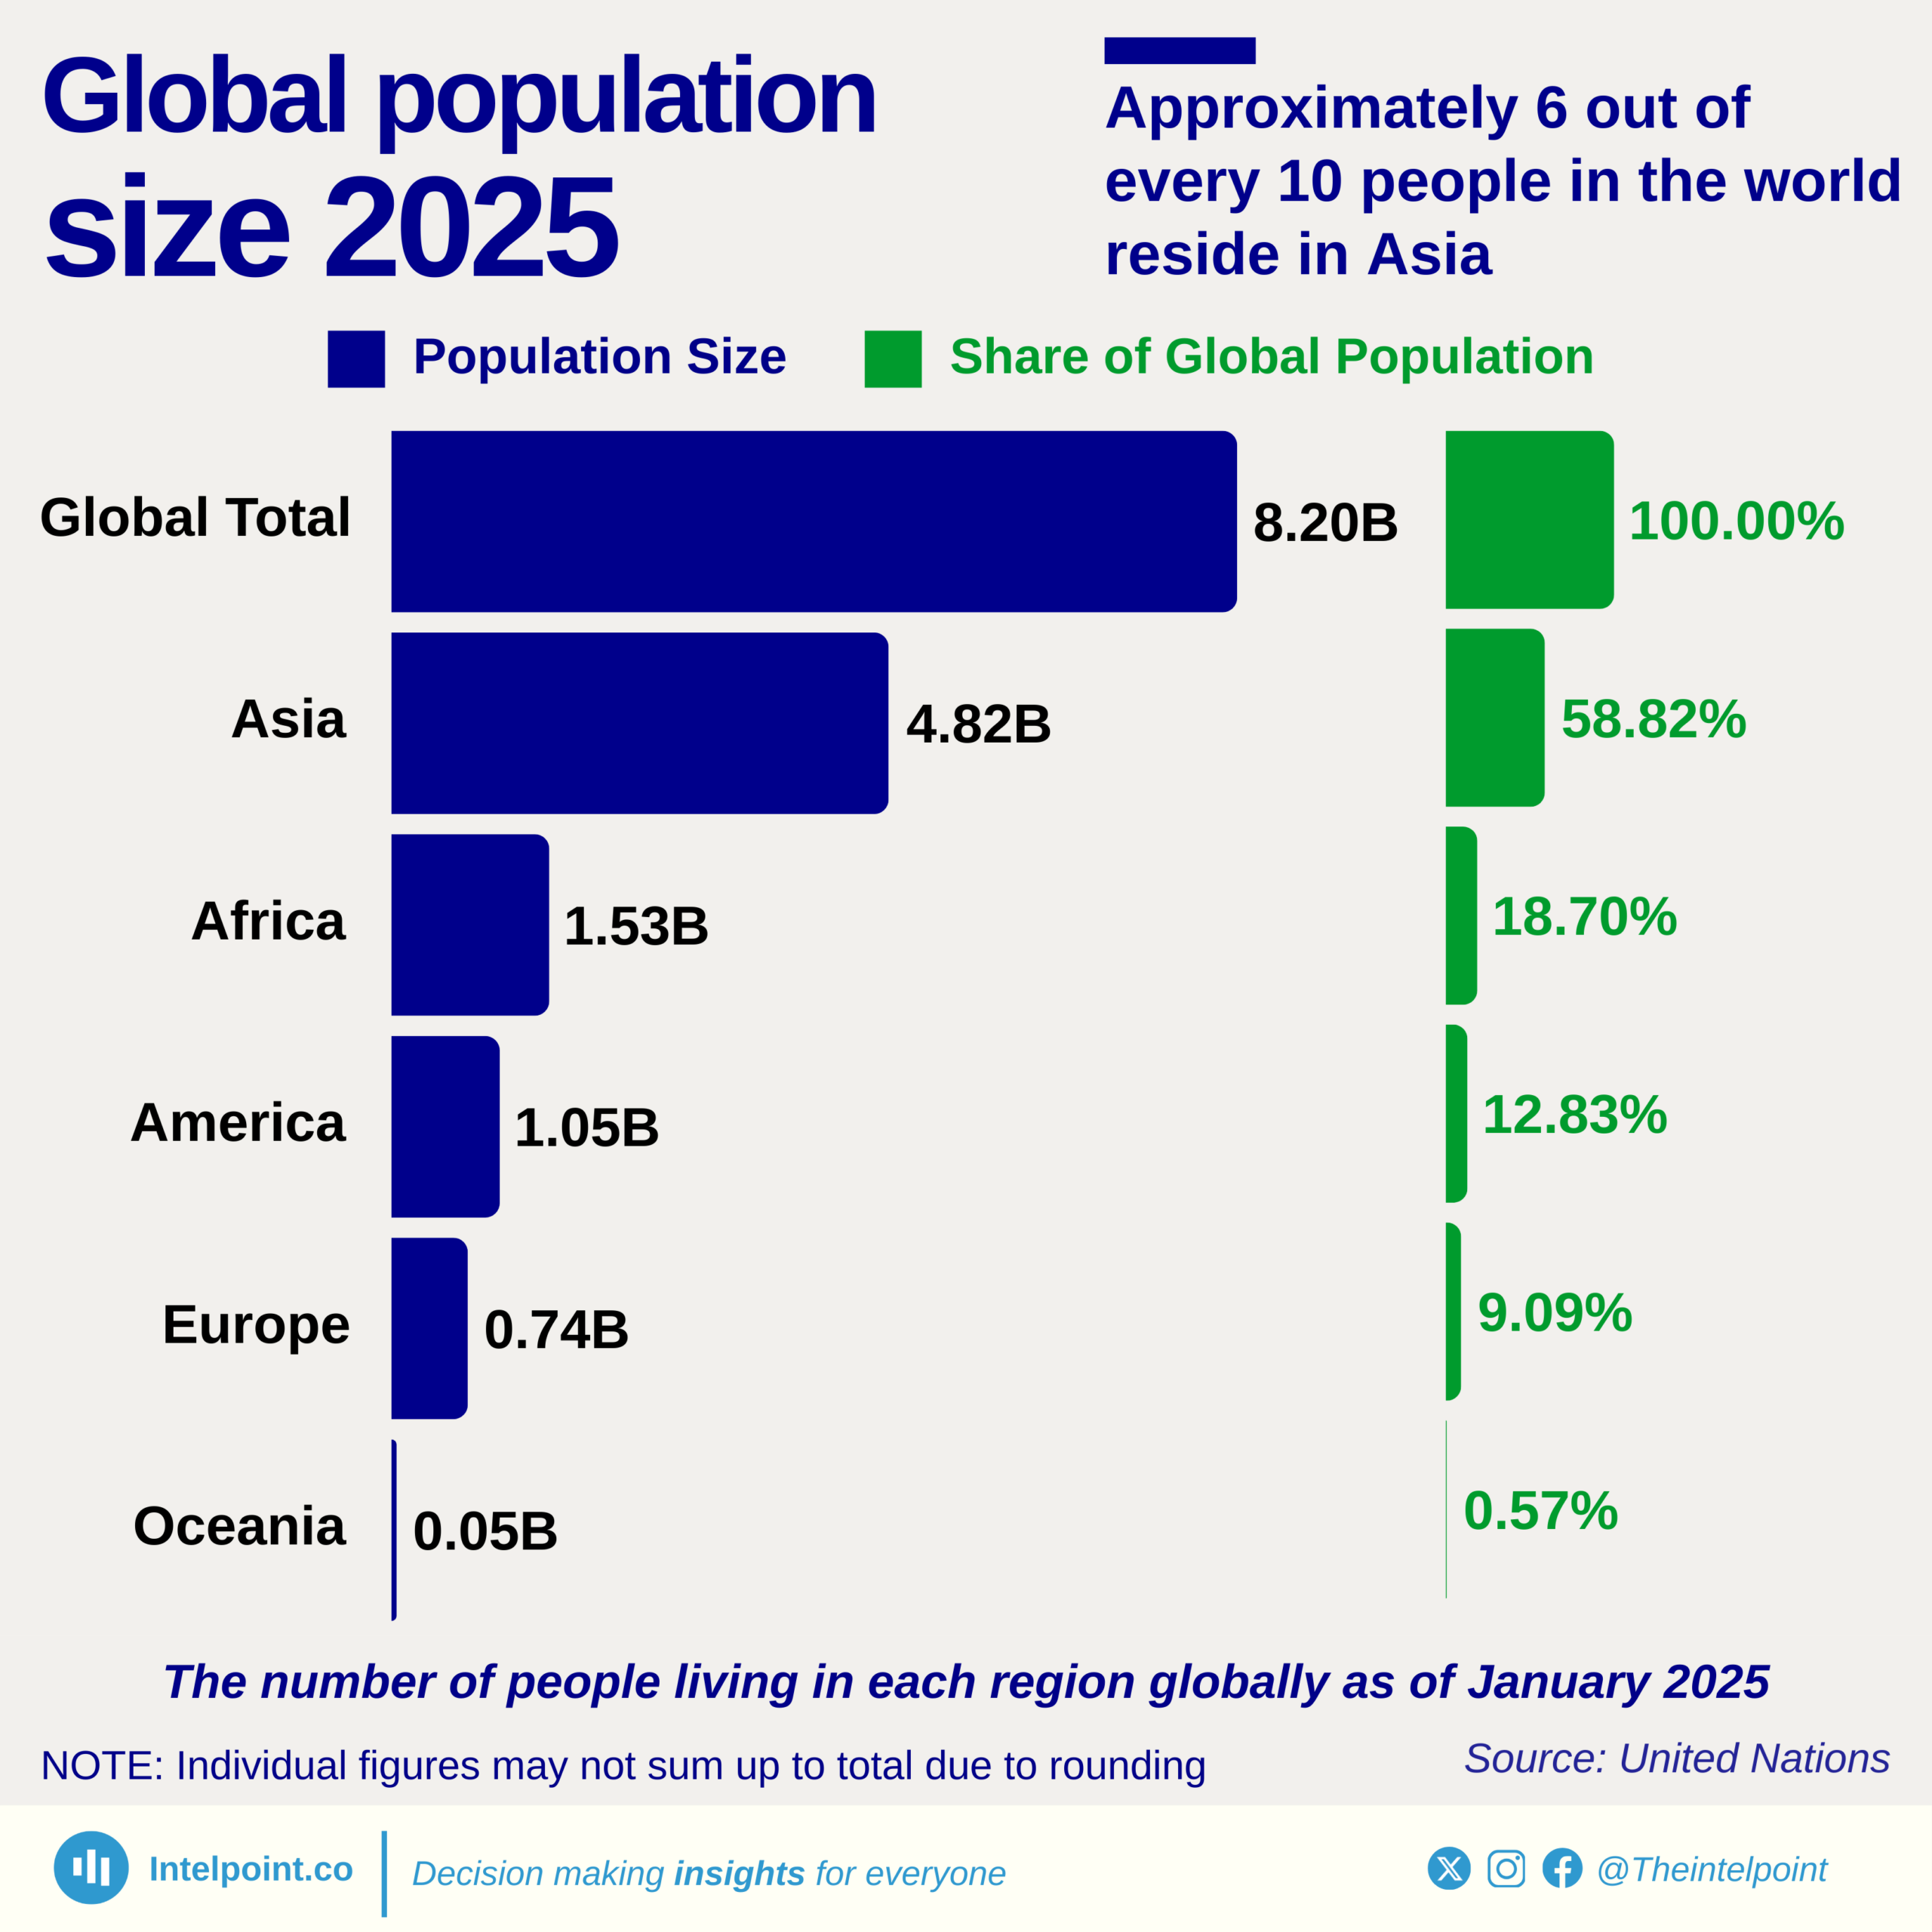
🗺️ Population Around the World
📋 Census
In India, the census is generally conducted every 10 years.
Information may include:
🌎 Population at a Glance
🇮🇳 India and the World
- India surpassed China as the world’s most populous country in 2023.
- Indians form around 17% of the world’s population according to the chapter.
- China, Japan and Italy are experiencing population decline.
- Several African countries are experiencing rapid population growth.
📈 Understanding Population Pyramids

📊 What Determines the Population of a Country?
The population of a country changes because of three major processes: births, deaths and migration.
👶 Birth Rate
Number of live births per 1,000 population in a year.
👩👧 Fertility Rate
Average number of children a woman is likely to have during her lifetime.
⚰️ Death Rate
Number of deaths per 1,000 people in a year.
🚶 Migration
Movement of people from one place to another, within or outside a country.
👶 Birth Rate and Fertility Rate
Number of live births per 1,000 population in a year.
Average number of children a woman would have during her lifetime.
A fertility rate of about 2.1 is called the replacement level because, under typical conditions, it is roughly the level needed to replace parents in a population over time.
- Above replacement level → population is more likely to grow.
- Below replacement level → population may shrink over time.
- Lower fertility generally slows population growth.
🇨🇳 🇮🇳 Population Policies: China and India
China
China introduced the One-Child Policy in 1979 to control rapid population growth. The policy was later ended and China now allows families to have more children.
China’s fertility rate has remained below replacement level, contributing to population ageing and a shrinking population.
India
India promoted population-control campaigns such as “Hum do humare do”, encouraging smaller families.
India’s fertility rate has declined significantly over time.
❤️ Death or Mortality Rate
A lower mortality rate can indicate improvements in healthcare, nutrition and living conditions.
🇮🇳 India: Important Changes Mentioned in the Chapter
- Child mortality declined greatly over time.
- Life expectancy has increased considerably since independence.
- Better healthcare and nutrition have helped people live longer.
🚶 Migration
Why do people migrate?
🔄 Demographic Transition
Countries do not always have the same birth and death rates. As healthcare, education and economic conditions improve, population patterns change.
STAGE 1
High Birth Rate + High Death Rate
Population growth is very slow or stagnant. Poor healthcare and low literacy may contribute to high death rates.
STAGE 2
Death Rate Falls + Birth Rate Remains High
Better healthcare lowers deaths while births remain high. Population grows rapidly.
STAGE 3
Low Death Rate + Falling Birth Rate
Urbanisation, education, higher income and greater participation of women in the workforce can reduce birth rates.
👥 India’s Population: Composition and Trends
Population composition means the characteristics of people in a population.
⚖️ Sex Ratio
According to the figures mentioned in the chapter, India’s sex ratio improved from 933 females per 1,000 males in 2001 to 943 in 2011.
🔺 Population Pyramid
Easy Way to Read a Population Pyramid
- Look at the bottom → tells us about children.
- Look at the middle → tells us about working-age people.
- Look at the top → tells us about elderly people.
- Compare male and female sides.
💼 India’s Demographic Dividend
India has a large number of young people and working-age adults. If they receive good education, healthcare, skills and employment, they can contribute greatly to economic growth.
🎓 Education
Better education develops human capital.🛠️ Skills
Skilled workers can become more productive.💼 Jobs
Employment allows people to earn and contribute to the economy.🏥 Healthcare
Healthy people can study, work and contribute effectively.🧑🎓 Youth Bulge
A youth bulge means that a large proportion of the population consists of children and young adults.
The chapter explains that a large young population can become an economic advantage if there are sufficient opportunities for education, skills and employment.
👴 Ageing Population
An ageing population means that the proportion of elderly people is increasing.
Possible challenges
- Greater need for healthcare
- Need for elderly care
- More pension requirements
- Fewer workers to replace retiring workers
- Possible pressure on government finances
🌸 Older People Also Contribute
Older people continue to contribute to families and society by sharing knowledge, experience, traditions and wisdom.
🚀 Preparing for Demographic Change
📖 Important Terms
| Term | Easy Meaning |
|---|---|
| Demography | Study of population size, structure and changes. |
| Working-age Population | People generally between 15 and 64 years. |
| Census | Official counting and study of population. |
| Projection | Estimate of a future situation based on present trends. |
| Birth Rate | Live births per 1,000 population in a year. |
| Fertility Rate | Average number of children a woman has in her lifetime. |
| Mortality Rate | Number of deaths per 1,000 people in a year. |
| Migration | Movement of people from one place to another. |
| Life Expectancy | Average number of years a newborn is expected to live. |
| Sex Ratio | Females per 1,000 males. |
| Demographic Dividend | Economic opportunity from a large working-age population. |
| Pension | Regular payment made to people after or around retirement. |
| Productivity | Amount of goods and services produced using given resources. |
✅ Before We Move On
- Demography studies population size, structure and change.
- Births, deaths and migration affect population.
- Population changes through demographic transition.
- Falling fertility can lead to slower or negative population growth.
- India has a large working-age population.
- This creates a demographic dividend opportunity.
- Education, employment and healthcare are important for using this opportunity.
- Many countries are facing population ageing.
- Governments need to prepare for changing population structures.
📚 Questions and Activities – Complete Book Solutions
All textbook questions are given below in the same order. Answers are written in simple, short and student-friendly language.
Having fewer children can make it easier for parents to spend more time and resources on each child’s education and health. However, family size alone does not guarantee better outcomes. Good care and resources are also important.
a) Has the life expectancy in India increased? If yes, what could be the reasons?
b) What was the life expectancy of males and females in 2010?
b) According to the graph provided in the textbook, students should read the male and female values at the year 2010 and write those values in their notebooks.
India can make the most of it by providing good education, healthcare, skill training, employment opportunities, entrepreneurship support and suitable infrastructure.
Population size
Fertility rate
Life expectancy
Age distribution
How are they different? What might be the reasons behind these differences? For instance, find out how countries with ageing populations are managing this.
Differences are related to fertility rates, life expectancy, economic development, healthcare, education, urbanisation and family-size patterns.
Japan has responded to population ageing through measures such as raising the retirement age and using technology and automation to deal with labour shortages.
Name of the person
Age of the person
Occupation of the person
Place of residence
Number of years lived in the place
List the factors contributing to migration, such as lack of facilities, poor infrastructure, limited job opportunities and so on.
- Name of the person: __________________________
- Age: __________________________
- Occupation: __________________________
- Place of residence: __________________________
- Number of years lived in the place: __________________________
- Where did you live before moving here? __________________________
-
Why did you migrate?
☐ Job ☐ Education ☐ Better facilities ☐ Family ☐ Safety ☐ Natural disaster ☐ Other: ____________ - What was the most important reason for migration? __________________________
Age-group-wise percentage distribution of population (estimated for 2021)
| Age Group | Male | Female |
|---|---|---|
| 0–4 | 8.6 | 8.2 |
| 5–9 | 8.9 | 8.4 |
| 10–14 | 8.7 | 8.6 |
| 15–19 | 9.3 | 9 |
| 20–24 | 9.5 | 9.1 |
| 25–29 | 9 | 8.6 |
| 30–34 | 8.1 | 8 |
| 35–39 | 7.1 | 7.4 |
| 40–44 | 6.3 | 6.7 |
| 45–49 | 5.7 | 6 |
| 50–54 | 5 | 5.2 |
| 55–59 | 4.2 | 4.2 |
| 60–64 | 3.2 | 3.3 |
| 65–69 | 2.4 | 2.7 |
| 70–74 | 1.8 | 2.1 |
| 75–79 | 1.2 | 1.4 |
| 80+ | 0.9 | 1.2 |
- Draw a vertical age axis.
- Write the age groups from youngest at the bottom to oldest at the top.
- Use the left side for males.
- Use the right side for females.
- Draw bars according to the given percentages.
- Give the graph a suitable title and label both sides.
This indicates a low birth rate and an ageing population. Japan therefore needs more healthcare and elderly-care services and may face a shortage of young workers.
🔎 Let’s Explore – Easy Answers
Activity 1
Ask your family members if they have observed any of the following changes around them over the years:
- Farmland or green spaces being turned into buildings.
- More crowded streets and traffic.
- Changing types of homes.
Activity 2
Why is the replacement rate 2.1 and not 2 (parents get replaced by children)?
Activity 3
Observe fertility and literacy rates in select Indian states. Do you find a relationship between the two indicators?
Activity 4
If many young people migrate from villages or smaller towns to cities, what changes could take place in their native villages?
Activity 5
If the replacement rate is less than 2, what will the population pyramid look like? Will there ever be a situation where the number of children is less than the number of aged people?
Activity 6
Can you think of all the ways in which older people in your neighbourhood contribute to their family and society?
⚡ Quick Revision
⏱️ One-Minute Revision
Demography tells us about people. Population changes because of births, deaths and migration.
A high birth rate can make population grow rapidly. A low fertility rate can eventually lead to a shrinking population.
A population pyramid shows the distribution of people by age and gender.
India has a large working-age population, giving it a demographic dividend opportunity.
Education, healthcare, skills and jobs are important for turning this opportunity into economic progress.
Many countries are experiencing population ageing, which increases the need for elderly care, healthcare and pensions.
🖼️ Visual References
The visual examples used on this page are included to make population concepts easier to understand. Population statistics in the chapter itself should be studied according to the textbook figures and dates provided there.
Population-pyramid visual references and current demographic visualisations are available from public demographic data sources such as the United Nations-based population-pyramid resources.
Class 8 Social Science Part 2 Chapter 6, Class 8 Social Science Chapter 6 Notes, Dynamics of Population, Class 8 Social Science Part 2 Chapter 6 Notes and Book Solutions, Dynamics of Population Notes, Dynamics of Population Book Solutions, Class 8 Social Science Questions and Answers, Class 8 Social Science Part 2 Solutions, NCERT Class 8 Social Science, NCERT Class 8 Social Science Part 2, CBSE Class 8 Social Science, Class 8 Social Science Study Material, Class 8 Social Science Revision Notes, Class 8 Social Science Worksheets